SUPPLEMENTAL INFORMATION FOR MOLECULAR FLOW CALCULATIONS
L/D ERROR CURVE FOR SHORT PIPES
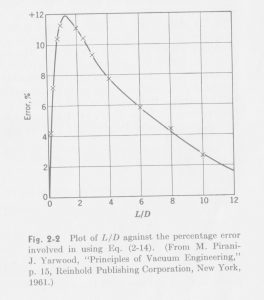
From the previous calculations, and going forward with future calculations dealing with conductances for molecular flow, one of the correction factors that is applied is an additional correction for the L/D ratio for short pipes. This correction is included to allow for worst case ideal scenario estimates for the system. Since each component is calculated individually, and since they are very short lengths, modified equations must be used from the common equation for molecular flow conductance for long pipes. First, the conductance for the pipe is calculated using the standard equation for long pipes. Then, an equation is used to account for a short pipe with a low L/D ratio. This is usually applied for L/D ratios less than 5, where L is length and D is diameter. Finally, the additional error correction value is applied. For these calculations, the correction factor used is around +12% error maximum, and is a factor found experimentally in literature, as a deviation from expected results. Applying this would result in lower calculated conductances, but would provide a better worse-case analysis for the calculated components. Below is a scanned photo of the original error curve used for reference in the system calculations dealing with short tubes (usually 12% for most of the presented calculations). This was taken from a rather excellent book on vacuum engineering, one that is personally highly recommended on the fundamentals of vacuum systems:
“Fundamentals of Vacuum Science and Technology”
Gerhard Lewand, Ph.D.
Plasma Physics Laboratory, Princeton University
Copyright 1965 by McGraw-Hill, Inc.
As can be seen from the graph, for very short lengths (where an orifice would equal a length of 0), the error is incredibly small. However, this rapidly rises up until a maximum value between an L/D ratio of 1 and 2 of 12%, then drops off as the L/D ratio increases. For long pipes, error is less, and the equations governing conductance are more in line with what is expected vs. measured experimentally, where larger variations can occur for short pipes. The above curve was measured via air, however the error was applied to other gases in the calculations for approximately similar worst case estimation.

