OVERVIEW
TRIM simulations of sputtering and implantation from DC glow discharge plasma in stainless steel are presented. In the case of preparing and conditioning high vacuum chamber systems, a common method employed is that of glow discharge plasma cleaning. Using this method, surfaces are cleaned with a glow discharge plasma from impinging ions upon the surface from the generated plasma, between the anode and cathode at a given potential. For DC glow discharge plasma cleaning of a vacuum chamber surface, an anode electrode located in the chamber ionizes a plasma, where the chamber walls act as a cathode. The resulting bombardment from ions allows for several different mechanisms of cleaning. Depending on the gases used, both physical cleaning and chemical cleaning can occur, generally in the form of sputtering of surface contaminants. For a given gas and potential, sputtering yields can change, as well as result in implantation of the cleaning gases into the target surface. Depending on the experimental setup, this could have various effects on experimental results. Although the plasma ions can remove surface contaminants, the process can result in implantation of the ions in the chamber walls themselves. For devices such as fusion reactors, this can present extra gas loads and contamination of the fuel as the embedded ion slowly desorb from the chamber walls. Further baking is often required to remove these implanted gases from the walls.
For a given DC voltage potential between electrodes, various regions form in the glow discharge plasma. The area of main interest for determining the resulting impinging ion energy is that of the cathode layer sheath, a region that forms between the bulk plasma and the surface of the cathode. A variety of parameters can effect the thickness and density of this sheath, which ions from the bulk plasma must traverse through before they reach the cathode surface. As a result, primarily due to collisions, ions from the bulk plasma lose energy and strike the cathode surface with a particular energy distribution. From the work presented by Davis and Vanderslice in 1963, a general equation for determining the ion energy distribution of a DC glow discharge plasma was found and experimentally measured. Further works from other authors have found very good agreement to this model for simple mono-atomic gases.
The constant m parameter of the Davis and Vanderslice equation, which was presented with a value of m=2 in the original paper, representing electric field linearity, was modified by Budtz-Jorgensen in 2001 based on derivations for the Child Collision Law to better match particle-in-cell simulation results. The work presented by Budtz-Jorgensen utilized a value of m=5/3 based on these derivations.
A key parameter of the Davis and Vanderslice distribution that strongly determines the ion energy distribution for the given plasma is the s/λ, in which s represents the sheath thickness and λ represents the ion collision mean free path, therefore giving the mean number of collisions for an ion traversing through the sheath. Based on the Child Collision law, for DC plasma discharges, s/λ is proportional to s x p, where p is the pressure, and in general, s x p remains constant. Because of this, the mean free path for a given pressure must be balanced by the sheath thickness, which results in the occurrence that variation of pressure does not affect the resulting ion energy distribution.
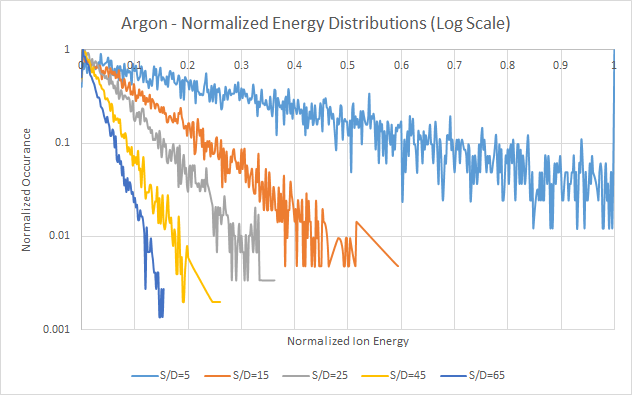
The default mode in TRIM allows only for a singular mono-energetic beam at a specific angle of incidence. In order to simulate more complex interactions with target materials, such as those from DC glow discharge plasmas, custom .DAT input files must be generated and run using TRIM that allows for a wider variation of input parameters for each flown ion. The following TRIM simulation results utilizes the Davis and Vanderslice energy distribution with the modified Butz-Jorgensen m parameter constant to generate ion energy distribution inputs for TRIM to compute resulting implantation and sputtering. Three different gases are studied: hydrogen, nitrogen, and argon. For each of these atoms, a variety of s/λ constants were selected to compare a wide range of resulting DC glow discharge plasma cases with various ion energy distributions. s/λ values of 5, 15, 25, 45, and 65 are used for each gas. As observed from measurements found in literature, in general, double-ionized ions such as Ar2+ and Ne2+ tend to follow energy distributions with very low s/λ values around 5, where single-ionized ions such as Ar+ and Ne+ have higher measured s/λ. Various parameters such as applied voltage and system topology can affect these numbers. As the s/λ decreases, the energy distribution increases towards a higher percentage of higher energy ions.
For each simulation, a set of 9999 ions were flown with a variety of distributions for various parameters. Starting position at the surface was selected, as well as randomly varied with a uniform distribution between -100 and +100 angstroms, for Y and Z (with X as the axis going into the target surface), as opposed to the standard TRIM random lateral variation of +/- one atomic diameter. The ion angle distribution of impinging ion angles upon the surface was selected from an average set of values found in literature. A tight Gaussian distribution around Cos(0) with a scale of 10 was selected to give angle distributions where roughly 80-85% of ions flown had angles of 10 degrees or less from directly normal to the surface.
A default stainless steel composition from the program consisting of 8% Chromium, 74% Iron, and 18% Nickel, with a total average density of 8 g/cm^3 was selected as the target.
DATA
I. RANDOM ION ENERGY INPUTS BASED ON DAVIS AND VANDERSLICE DISTRIBUTION
HYDROGEN

NITROGEN
ARGON
II. SIMULATION ION STATISTICS

III. ION IMPLANTATION DEPTH
HYDROGEN
NITROGEN

ARGON
IV. ION CONCENTRATION VS. RANGES
HYDROGEN
NITROGEN
ARGON

V. ION LOSSES DUE TO IONIZATION
HYDROGEN
NITROGEN
ARGON
VI. ION LOSSES DUE TO PHONONS
HYDROGEN
NITROGEN
ARGON
RESULTS AND DISCUSSION
I. RANDOM ION ENERGY INPUTS BASED ON DAVIS AND VANDERSLICE DISTRIBUTION
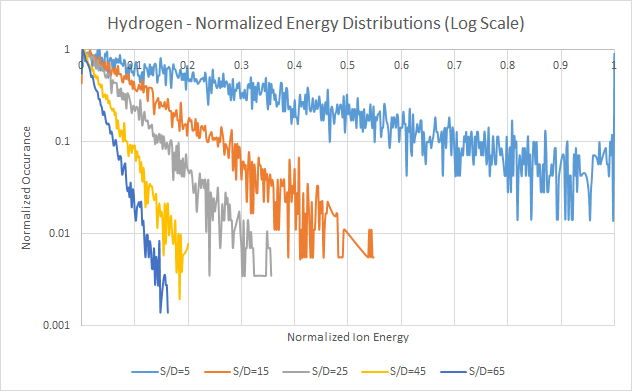
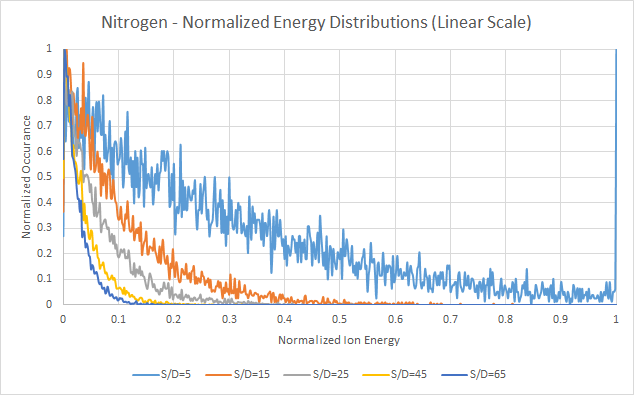
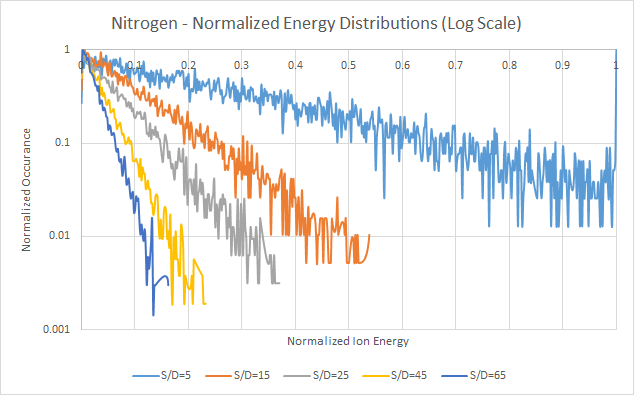
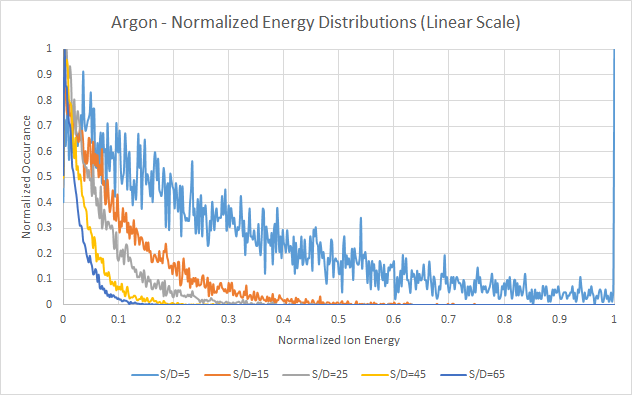
For each of the simulation runs, randomly generated ion energies using the Davis and Vanderslice distribution equation were employed. For each gas, five different s/λ values were used. The resulting random distributions are plotted to normalized energy and occurrence. Maximum energy is based on the maximum voltage present – in this case, 500VDC was used. Occurrence is based on evenly spaced bins from 0 to 500 in increments of 1, where the resulting numbers for each energy were counted and tallied. Both the normalized log and normalized linear plots are shown. As shown by Davis and Vanderslice, along with various other measurements and derivations in literature, as the s/λ value increases, the resulting distribution changes to an increasing number of lower energy ions. Actual s/λ values must be measured experimentally, and are dependent on the voltage, system topology, and other experimental settings. However, for a given operating pressure, using a set s/λ, cathode sheath thicknesses can be calculated and estimated. The wide range of s/λ numbers, from 5 to 65, represents a wide range of cases that are often observed experimentally in literature for simple mono-atomic gases.
II. SIMULATION ION STATISTICS
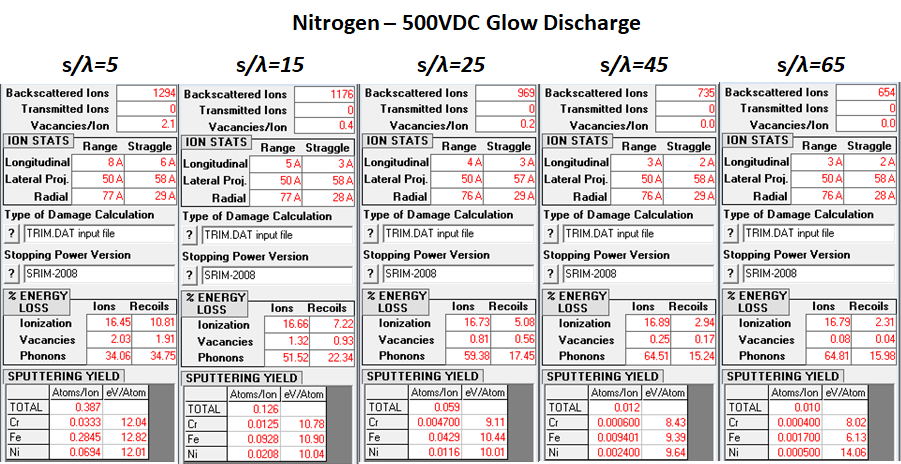
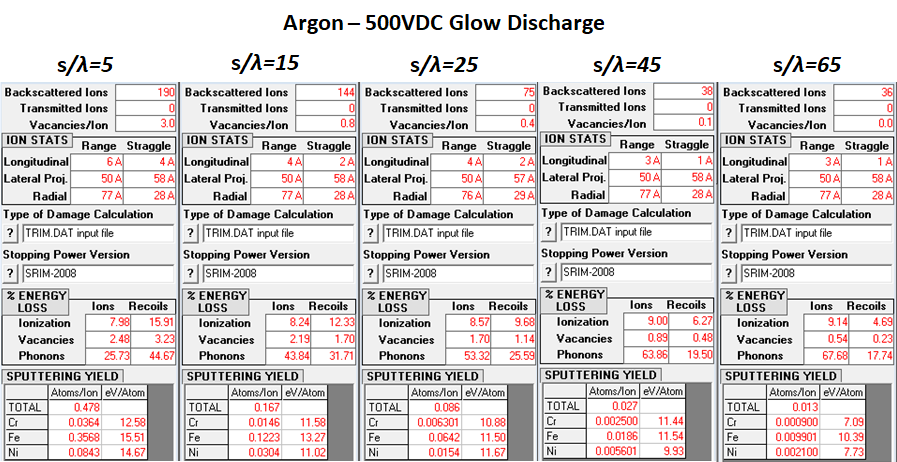
The above section presents the resulting ion statistics generated from each trim simulation. Several patterns can be observed, which are expected by the general ion energy distribution equation. For each of the three gases, as s/λ increases, the resulting number of backscattered ions decreases. This can be attributed to the fact that for lower s/λ values, there is a higher probability of higher energy ions. With a higher proportion of these higher energy ions, there is increased probability of implantation in the target surface. As also can be observed from the results, as ion mass increases, the overall number of backscattered ions decreases. Hydrogen exhibits much higher backscattering for an equivalent energy spread and s/λ than nitrogen or argon. The higher mass ions, for equivalent energy, carry more momentum and penetrating power to be able to implant into the dense target material.
For % energy loss however, there is a variation between hydrogen, nitrogen, and argon. The losses due to ionization refer to the energy lost from the impinging ion due to interactions with target atom electrons, for both primary atoms as well as recoiling atoms. As s/λ increases for hydrogen, the % energy loss due to ionization for ions shows a small but clear decrease. For nitrogen and argon however, there is a small increase in % energy loss due to ionization as s/λ increases. For recoil ionization losses, hydrogen does not exibit any from s/λ=15 to s/λ=65, with slight losses at s/λ=5. For recoil ionization losses, nitrogen decreases at much larger intervals than the increasing losses due to ionization from ions. In the case of argon, recoil ionization losses also decrease as s/λ increases.
For % energy loss due to phonons, there is a similar difference between hydrogen and nitrogen/argon. For hydrogen, both phonon losses due to primary atoms and recoiling atoms increase as s/λ increases. However, in the cases of nitrogen and argon, phonon losses due to primary atoms increases as s/λ increases, but phonon losses due to recoils decreases as s/λ increases. In the cases of nitrogen and argon, as s/λ increases, overall energy of ions decreases, which results in fewer target displacements, resulting in fewer recoiling losses, which explains the decrease in recoil losses in phonons as s/λ increases. For primary atom phonon losses, as the overall energy distribution decreases, impinging atoms due not have high enough energy to cause lattice displacements, resulting in greater energy transfer between the ions and target atoms, with fewer target atoms recoiling in their lattice structures. In the cases of nitrogen and argon, the bulk losses in the target material are due to phonons. However, for hydrogen, the bulk losses are due to ionization losses from target electrons.
In the case of sputtering yields, the results are as anticipated. As mass of the ions increase, for equivalent energy, higher sputtering yields result. For all cases for hydrogen, no sputtering of any atoms of the stainless steel target were recorded. Nitrogen and argon both yielded low amounts of sputtered atoms, with decreasing yields as s/λ increases as expected. As also expected, argon shows higher sputtering yields than that of nitrogen for equivalent energy distributions.
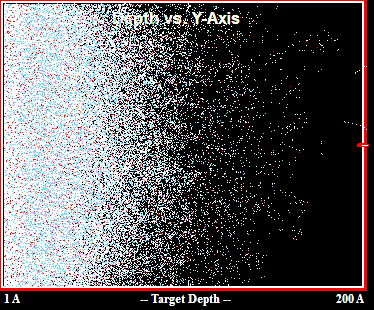
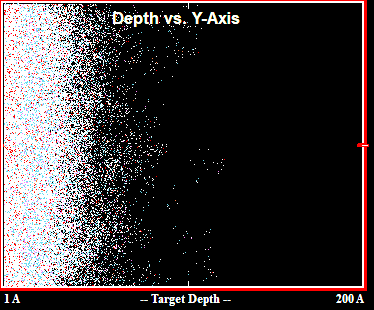
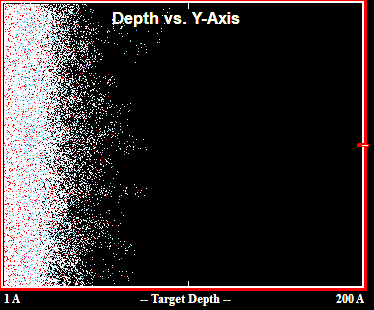
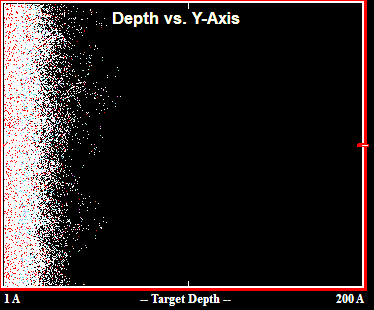
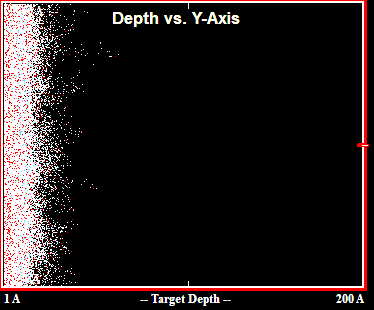
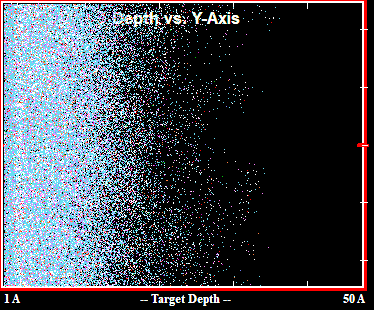
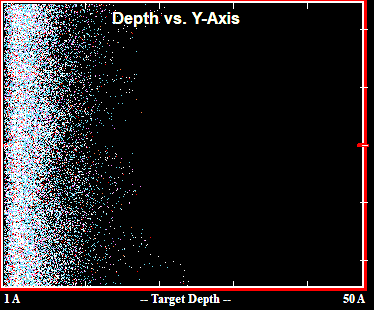
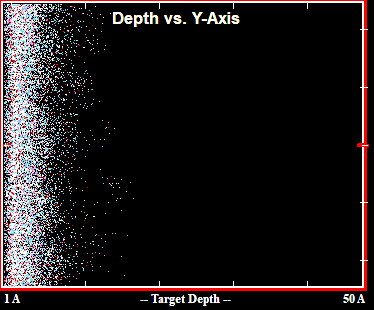
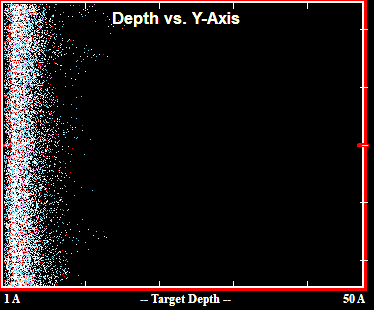
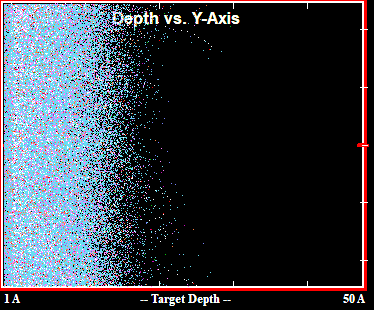
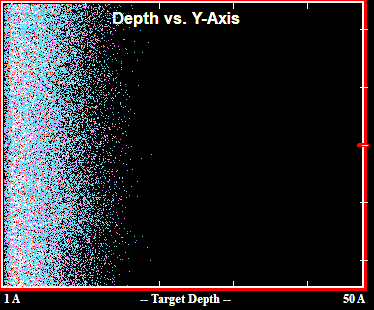
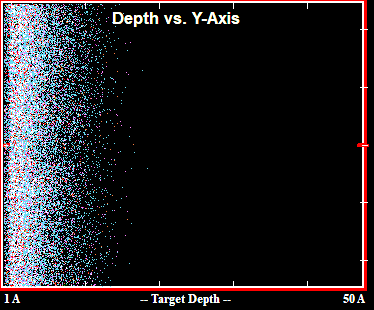
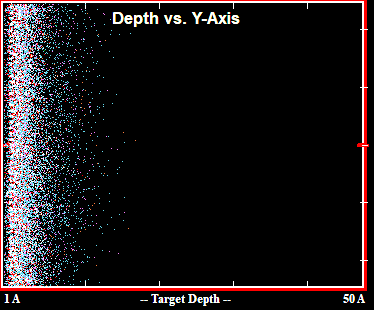
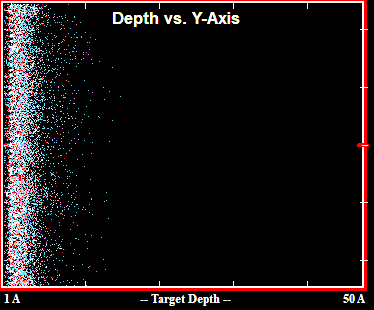
III. ION IMPLANTATION DEPTH
Graphs in this section depict the implantation depth of ions in the target material. As anticipated, as s/λ increases, ion depths decrease due to the decrease of the number of higher energy ions. All cases exhibit similar patterns for increasing s/λ numbers. The graphs also show that as ion mass increases, for an equivalent energy, the depth of penetration decreases, which is to be expected. In the case of hydrogen, depths of up to 200 angstroms can be observed from the 500VDC glow discharge plasma when s/λ=5, and decreases to about 50 angstroms for s/λ=65. Nitrogen exhibits max depths as well for lower s/λ, at about 45 angstroms. Argon follows the same trend, with max ion depths for a min s/λ value at about 35 angstroms. Despite the deeper travel of hydrogen, there are significantly fewer ion to lattice atom interactions, with losses primarily attributed to ionization losses. Nitrogen and argon however show increasing lattice atom interactions respectively, with losses primarily dictated by primary atom phonon interactions.
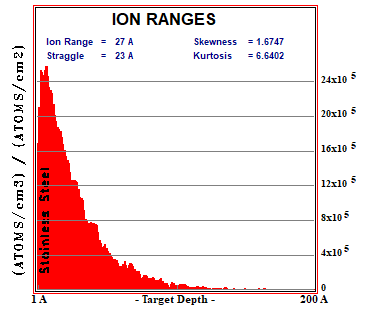
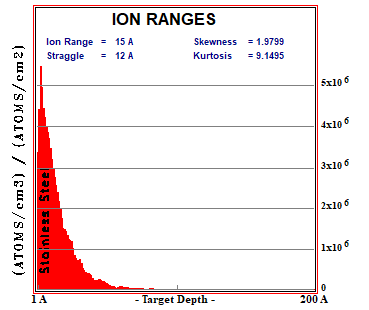
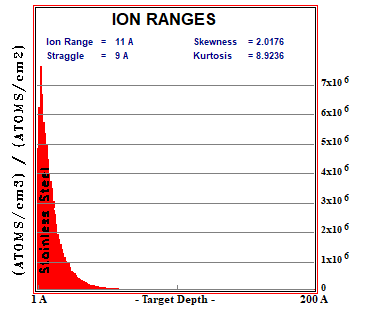
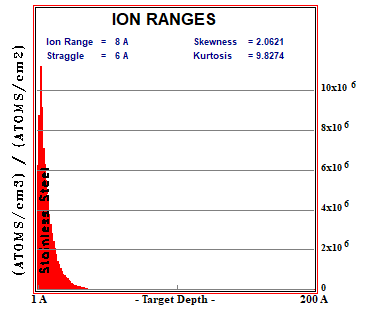
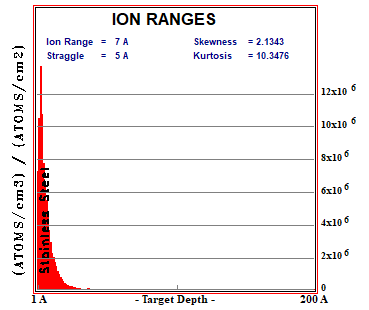
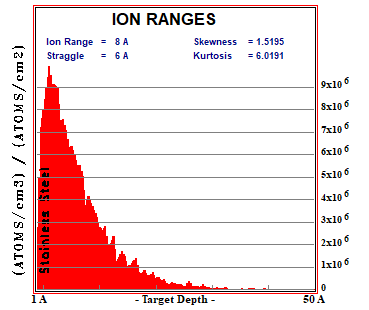
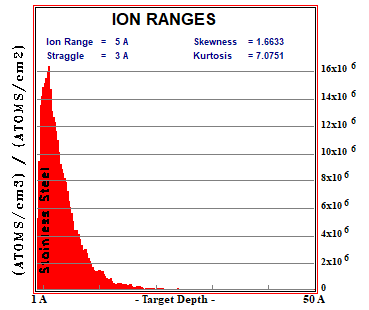
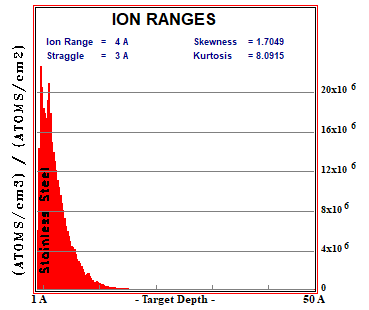
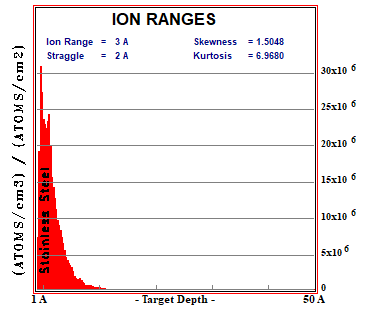
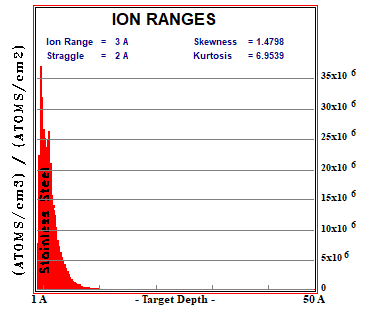
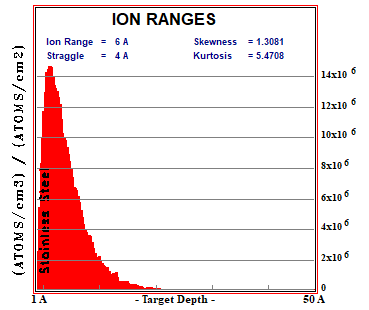
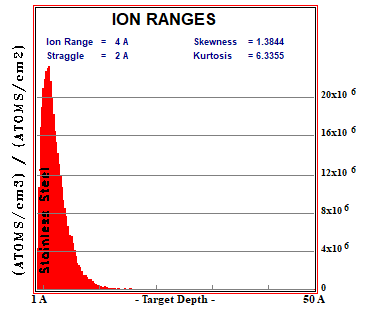
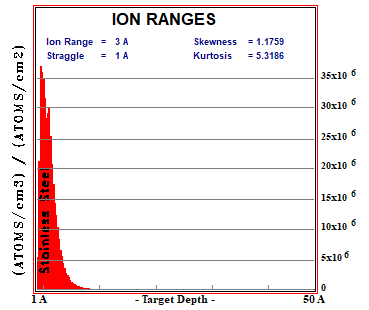
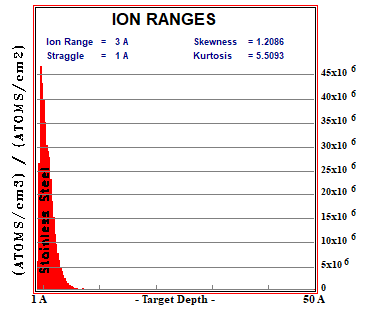
IV. ION CONCENTRATION VS. RANGES
The data graphs in this section depicts the ion concentrations vs. target depth. For all three cases, as s/λ values increase, the concentration of implanted ions shifts closer to the peak concentration value. However, the peak concentration value also increases for increasing s/λ, and stays relatively at the same depth. This again is attributed to the fact that as the ion energy distribution shifts towards a higher number of lower energy ions, target depth penetration reduces, and the bulk of implanted ions remains at shallower depths. Due to the distribution function, for all cases of s/λ, there is still an overall higher occurrence of lower energy ions than upper energy ions, so the peak shifts very little as s/λ changes. However, the trailing edge can greatly diminish, as higher energy ions can travel much farther in the bulk material.
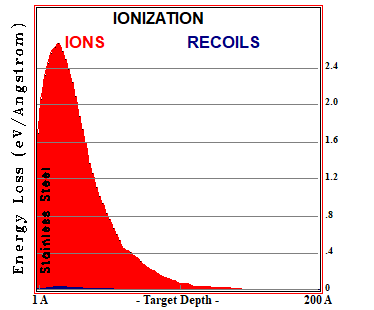
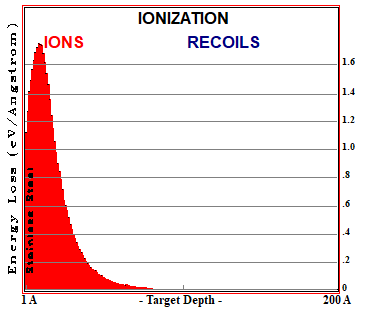
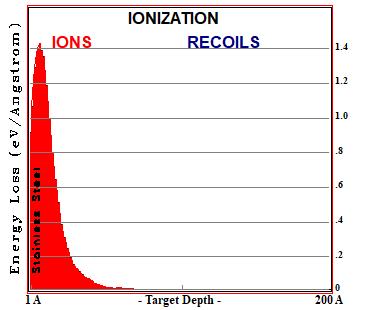
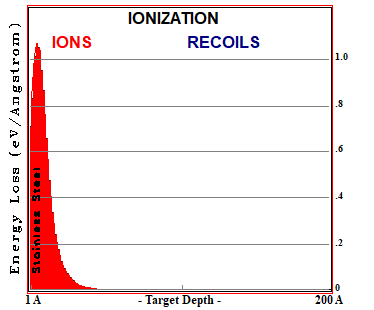
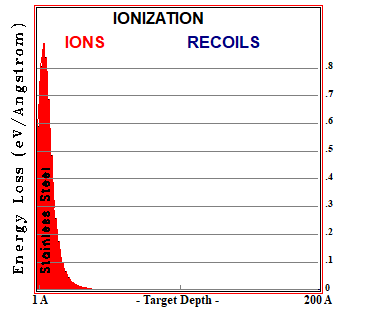
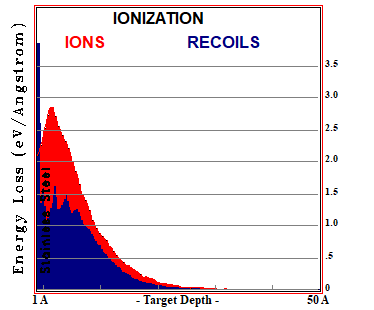
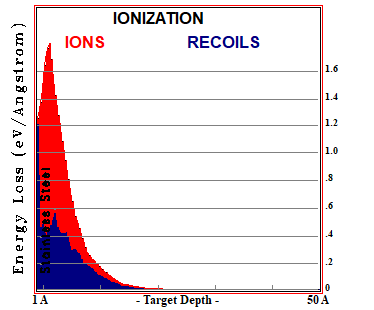
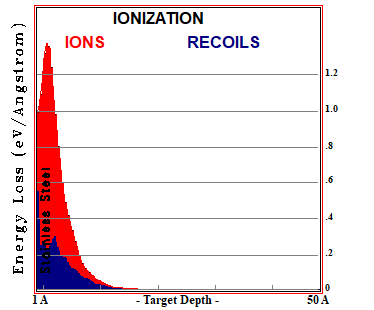
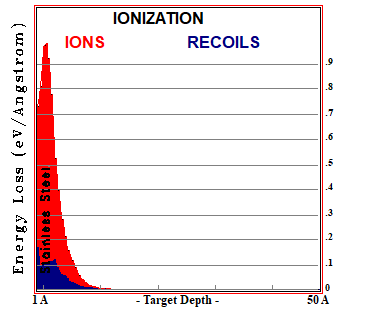
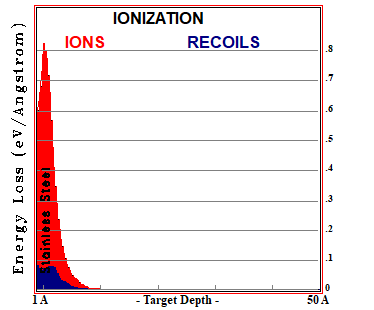
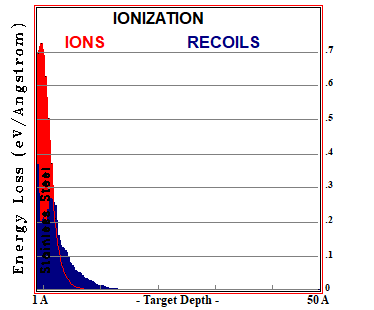
V. ION LOSSES DUE TO IONIZATION
The plots presented in this section elaborate the losses described in Section II dealing with the resulting simulation ion statistics. As previously described, losses due to ionization, or electronic losses, are losses of the impinging ion as a result of interactions with target atom electrons, both from the primary atom as well as recoiling atoms. The graphs show the relationship for ion losses in terms of stopping power in eV/angstrom, vs. the depth traveled in angstroms. As prior mentioned, the primary losses for hydrogen in the stainless steel target are due to ionization losses from primary atoms. Since very few to no recoils occurs due to the significant difference in mass between hydrogen ions and the target material ions, there are minimal to no resulting losses from recoils. As s/λ increases, fewer ions penetrate deep into the target, and because there is a higher probability of lower energy ions, ionization losses drop slightly as well.
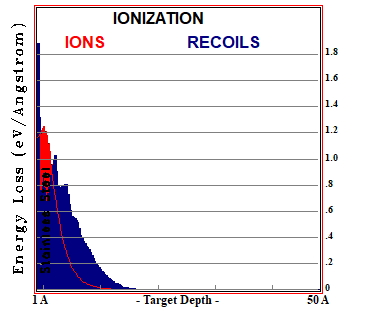
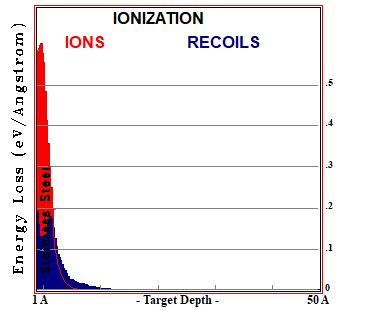
For nitrogen, the bulk of ionization losses are due to primary electrons as opposed to recoiling atom electrons. However, there is a large peak of recoil atom-electron losses for s/λ=5 near the surface. As the energy decreases, there is a noticeable decrease in recoil events, hence recoil losses contribute less as well.
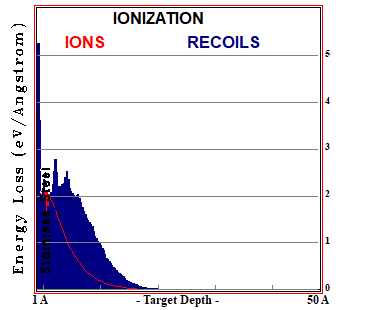
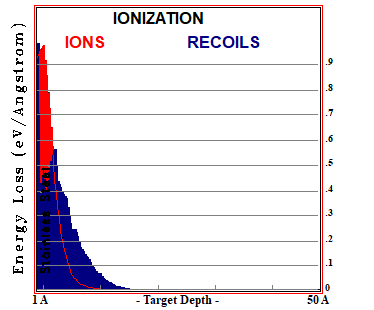
In the case of argon, ionization losses from recoiling atoms dominate for the higher energy distributions of s/λ=5 and s/λ=15, again with very large peaks near the very surface of the stainless steel target material. Since higher energy argon ions cause a much larger amount of recoil damage, resulting in higher sputtering of the target material, the contribution of recoils to energy loss of the ions is much higher than in the cases of hydrogen and nitrogen. Also for the case of argon it can be observed that recoil losses occur deeper than primary atom losses, which is associated with recoiling atoms being knocked further out of the original lattice position and potentially deeper into the target material. For the cases of nitrogen and argon, where large peaks for losses due to recoil ionization can be seen at the surface, this can be attributed to the fact that recoiling atoms are knocked towards the surface, which can be seen in sputtering of the surface material, hence resulting in greater losses from surface emerging recoiled atoms.
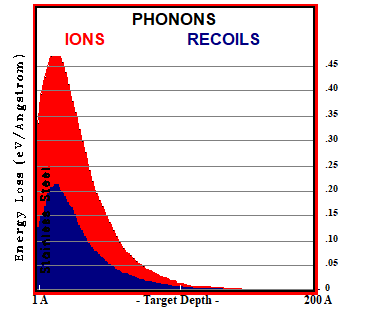
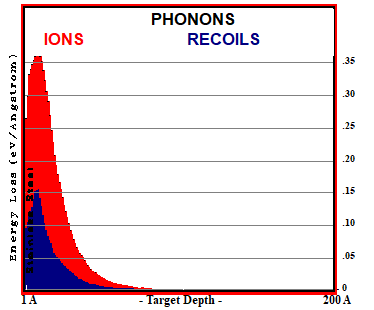
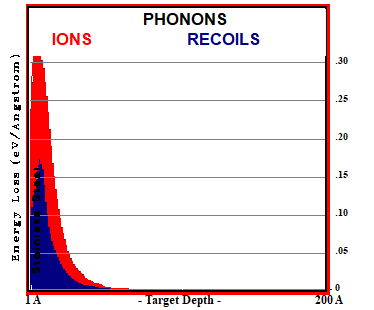
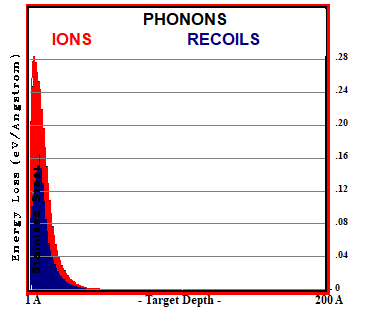
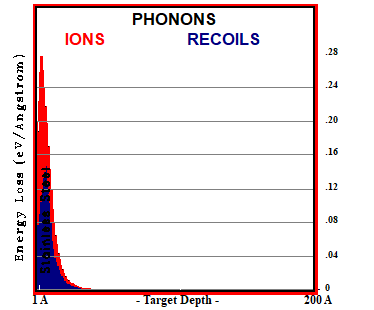
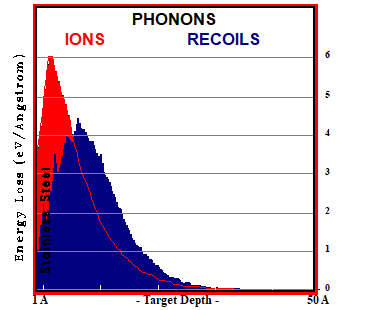
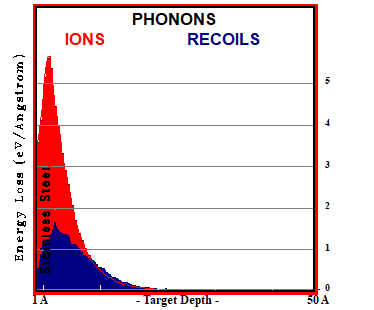
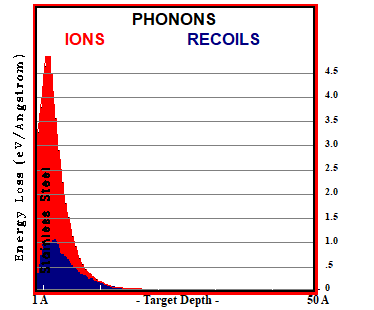
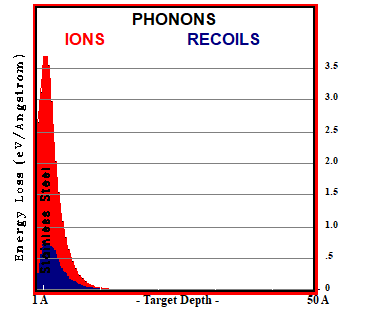
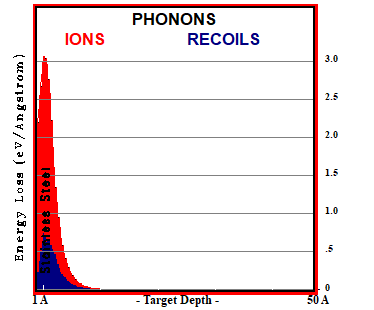
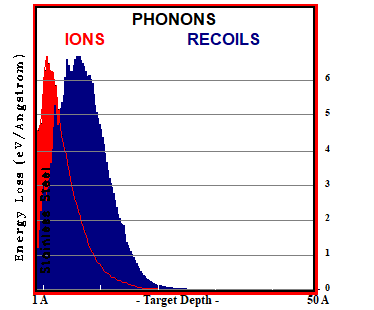
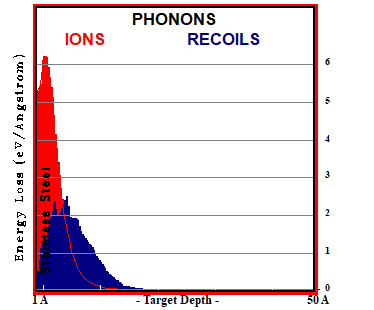
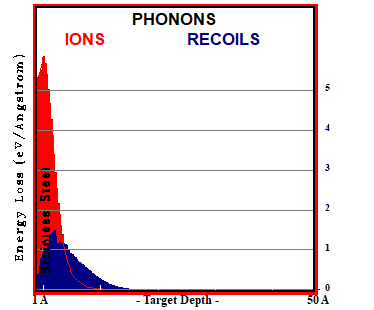
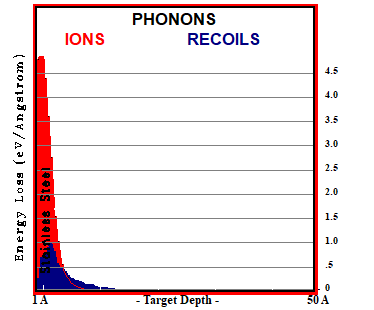
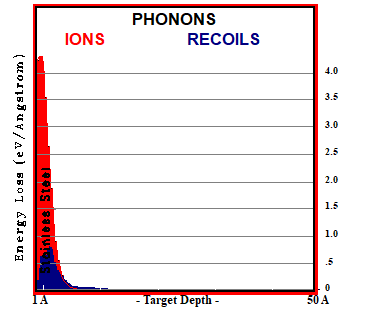
VI. ION LOSSES DUE TO PHONONS
The plots presented in this section elaborate the losses described in Section II dealing with the resulting simulation ion statistics. As previously described, losses due to phonons are losses of the impinging ion as a result of bulk lattice vibrations of the target material, both from primary target atoms as well as recoiling atoms. The graphs show the relationship for phonon losses in terms of stopping power in eV/angstrom, vs. the depth traveled in angstroms. As described above, as opposed to ionization losses which dominate losses for hydrogen, phonon losses dominate losses for the heavier and larger nitrogen and argon atoms. Phonon losses result in about an order of magnitude greater in stopping power for nitrogen and argon as opposed to hydrogen as well.
In the case of hydrogen, since hydrogen itself causes very little phonon production in the bulk lattice, both from minimal interaction with actual target atoms as well as significant lower mass of the hydrogen as opposed to target ions, phonon losses are minimal. Some recoil occurs, but is about half that of primary atom phonon losses, which overall represents a very small fraction of total losses of hydrogen atoms in the target material.
For the cases of nitrogen and argon, both share similar stopping losses due to primary target atom phonons. However, due to the larger mass of argon for a given energy, resulting in larger target recoils, target phonon losses due to recoils for the highest energy distribution of s/λ=5 are much larger for argon. For increasing s/λ values however, recoil losses are roughly the same for equivalent energy distributions between nitrogen and argon.
CONCLUSION
Data for 15 simulation runs utilizing advanced features of TRIM are presented to study the effects of a 500VDC glow discharge plasma on stainless steel using various gas sources. Hydrogen, nitrogen, and argon are simulated. Energy distributions based on the Davis and Vanderslice model for DC glow discharge plasmas, with a modified parameter of m=5/3 as presented by Budtz-Jorgensen is employed. A tight Gaussian impinging ion angle distribution is used, and ions are randomly flown into the target surface over a wider varying range.
Data for backscattered ions, sputtering yields, implantation depths, and ion losses in the target material are presented. As expected, for increasing s/λ values, sputtering yields and depths decrease. In addition, for higher atomic weights, sputtering yields increase while penetration depth decreases. Recoils and phonon production also increase as energy increases as well as ion mass. In the case of hydrogen, no sputtering was observed for all cases of s/λ values for a 500VDC glow discharge plasma. Ionization losses also dominate the stopping losses for hydrogen as well. Hydrogen exhibits further travel in the target material with minimal interactions with target atoms. In the case of nitrogen and argon, sputtering yields were observed, with argon yielding higher sputtering rates for equivalent energy distributions. For both nitrogen and argon, stopping losses in the target material are dominated by phonons.
The presented code and methodology serves as a starting point for employing other custom distribution functions and parameters for future simulations of a wide variety of advanced plasma and ion beam interactions with target materials using TRIM.
SOURCE CODE AND DOCUMENTATION
REFERENCES
- W. D. Davis and T. A. Vanderslice. Ion Energies at the Cathode of a Glow Discharge. Physical Review Volume 131 (1963).
- Casper V. Budtz-Jorgensen. Studies of Electrical Plasma Discharges. (2001).
- J. A. Rees, C. L. Greenwood, A. J. Carew, I. D. Neale, Y. Aranda Gonzalvo, and M. E. Buckley. Ion Energy Distribution for a DC Plasma.
- Rod S. Mason and Richard M. Allot. The Theory of Cathodic Bombardment in a Glow Discharge by Fast Neutrals. Journal of Physics D: Applied Physics 24 (1994).
- S. Peter, R. Pintaske, G. Hecht, and F. Richter. Ion Energy Distribution Measurements in Glow Discharges. Journal of Nuclear Materials 200 (1993).
- Tsuyohito Ito and Mark A. Cappelli. Ion Energy Distribution and Gas Heating in the Cathode Fall of a Direct-Current Microdischarge. Physical review E 73 (2006).
- E. S. Aydil, B. O. M. Quiniou, J. T. C. Lee, J. A. Gregus, R. A. Gottscho. Incident Angle Distributions of Ions Bombarding Grounded Surfaces in High Density Plasma Reactors. Materials Science in Semiconductor Processing 1 (1998).