Introduction
In the previous blog post, an in-depth overview was provided to exemplify the differences between the V1 and V2 versions of the closed-loop peltier chilled cooling system. Over the past week, I have had an opportunity to finally run the first preliminary testing of the cooling system. A tremendous amount of useful data was collected, which revealed some significant shortcomings of the originally proposed V2 system – some of these issues were large enough to warrant an upgrade to several key parts of the system. The cooling system is now on its current V2.1 iteration, and it is anticipated there should be noticeable improvement in the system performance. In this post I will walk through the test setup and data that was collected for these initial qualification runs.
Establishing a Test Load
With the cooling system build complete, it was finally time to start running some tests. The main load of the cooling system is the high vacuum diffusion pumps that are used for the vacuum systems in the experimental setups. Unfortunately, I am still a long way off from actually running the diffusion pumps and pulling vacuum. Adapter plates need to be made between the diffusion pump, the baffle, and the chamber, and the first experimental tests need to be designed and constructed. In addition, other materials will be needed for the high vacuum system to function properly, such as o-rings and diffusion pump oil. The high vacuum cooling and control system needs to be complete, with all of the control, monitoring, and interlocks in place. As a result, I needed some sort of similar thermal load to simulate the diffusion pump with the cooling system for the time being.
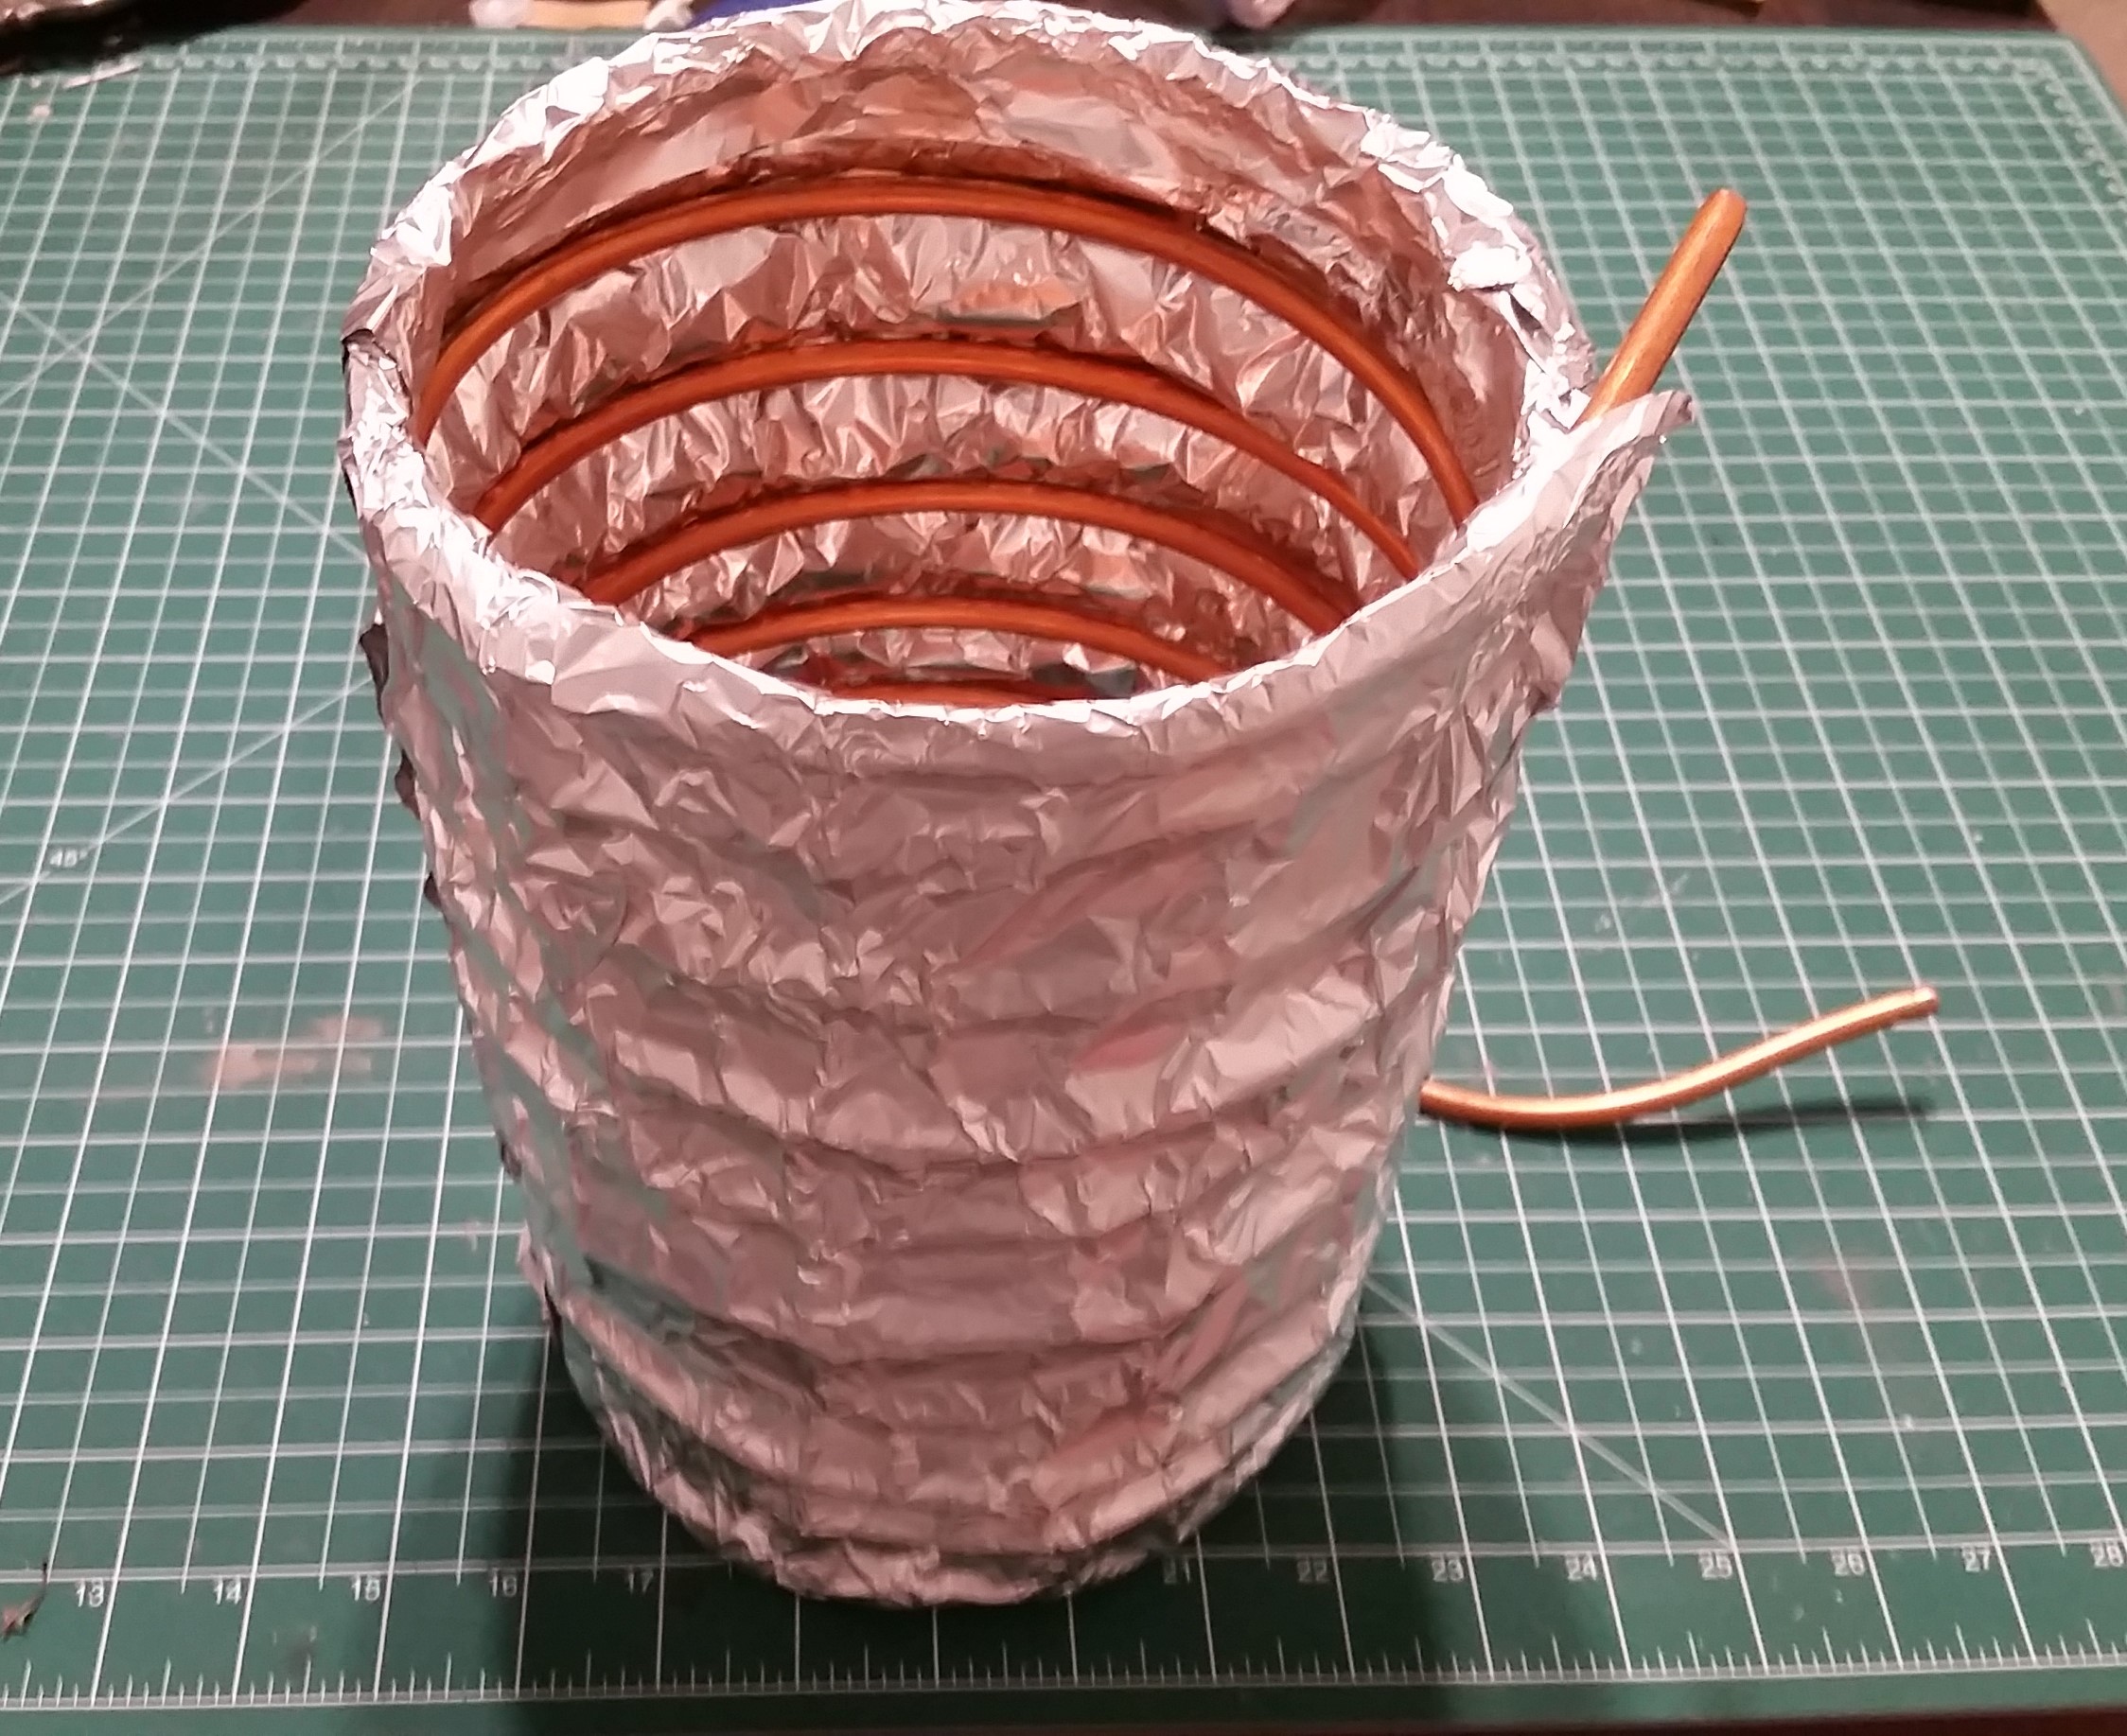
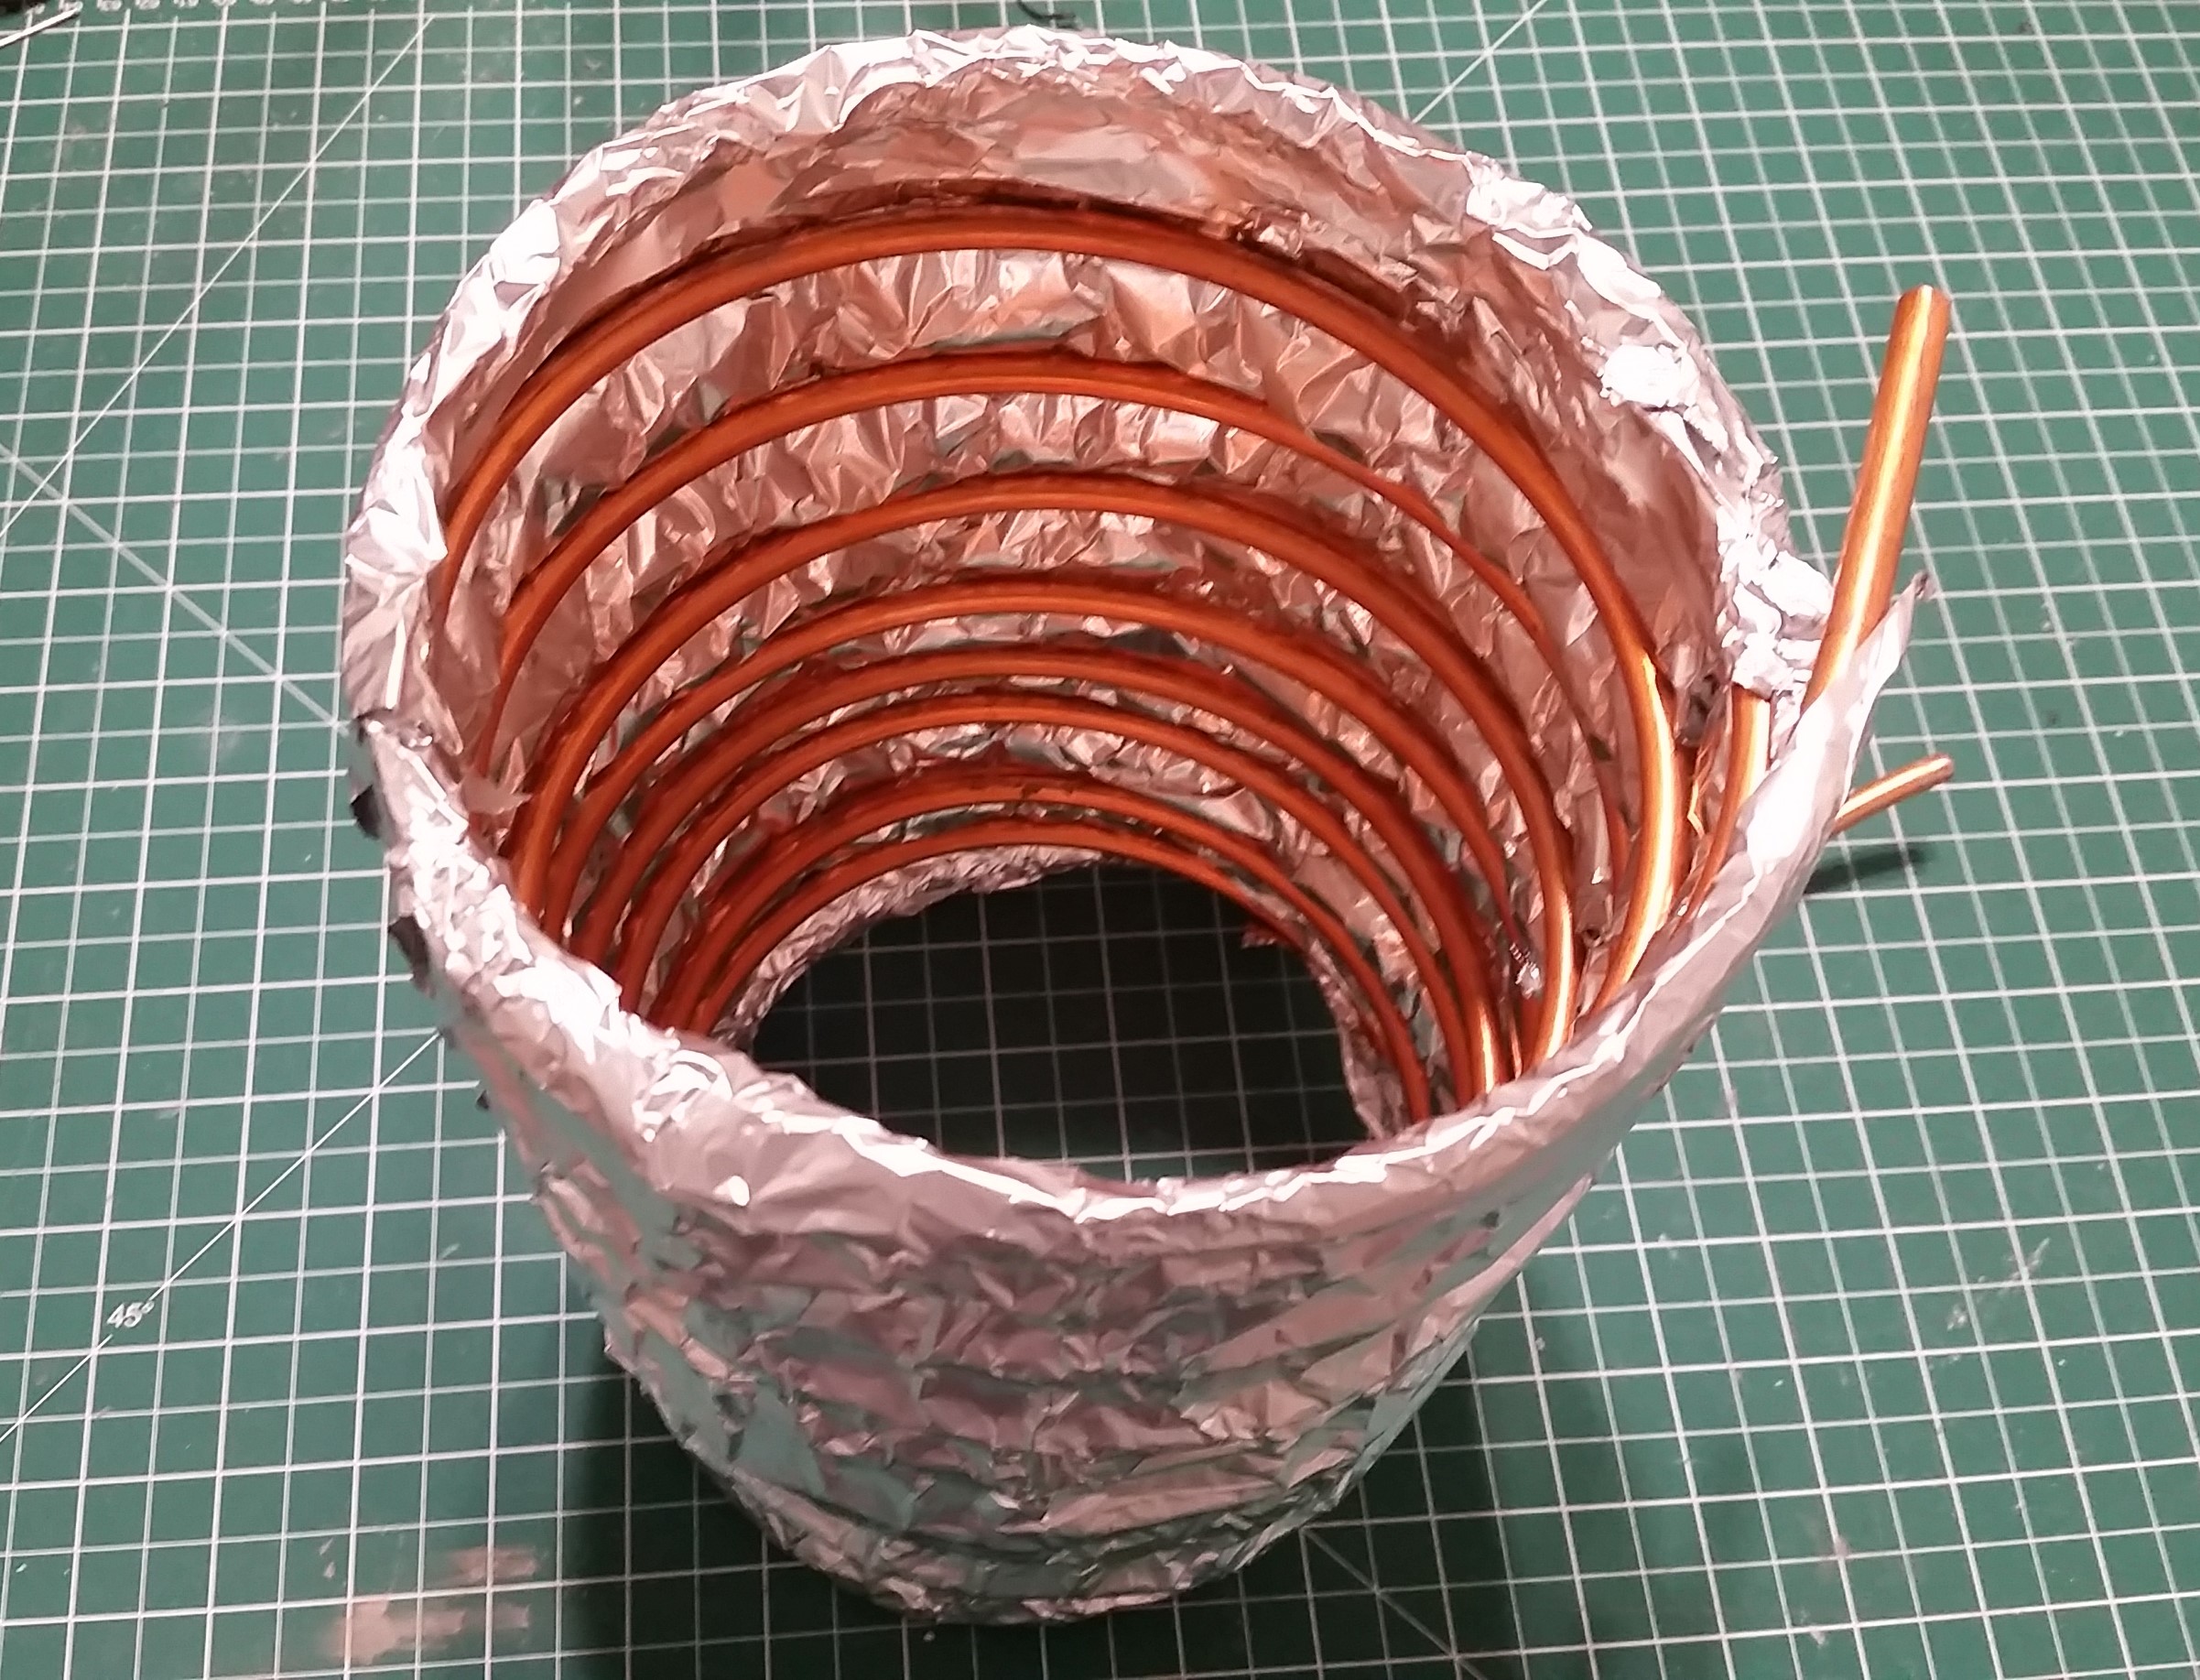
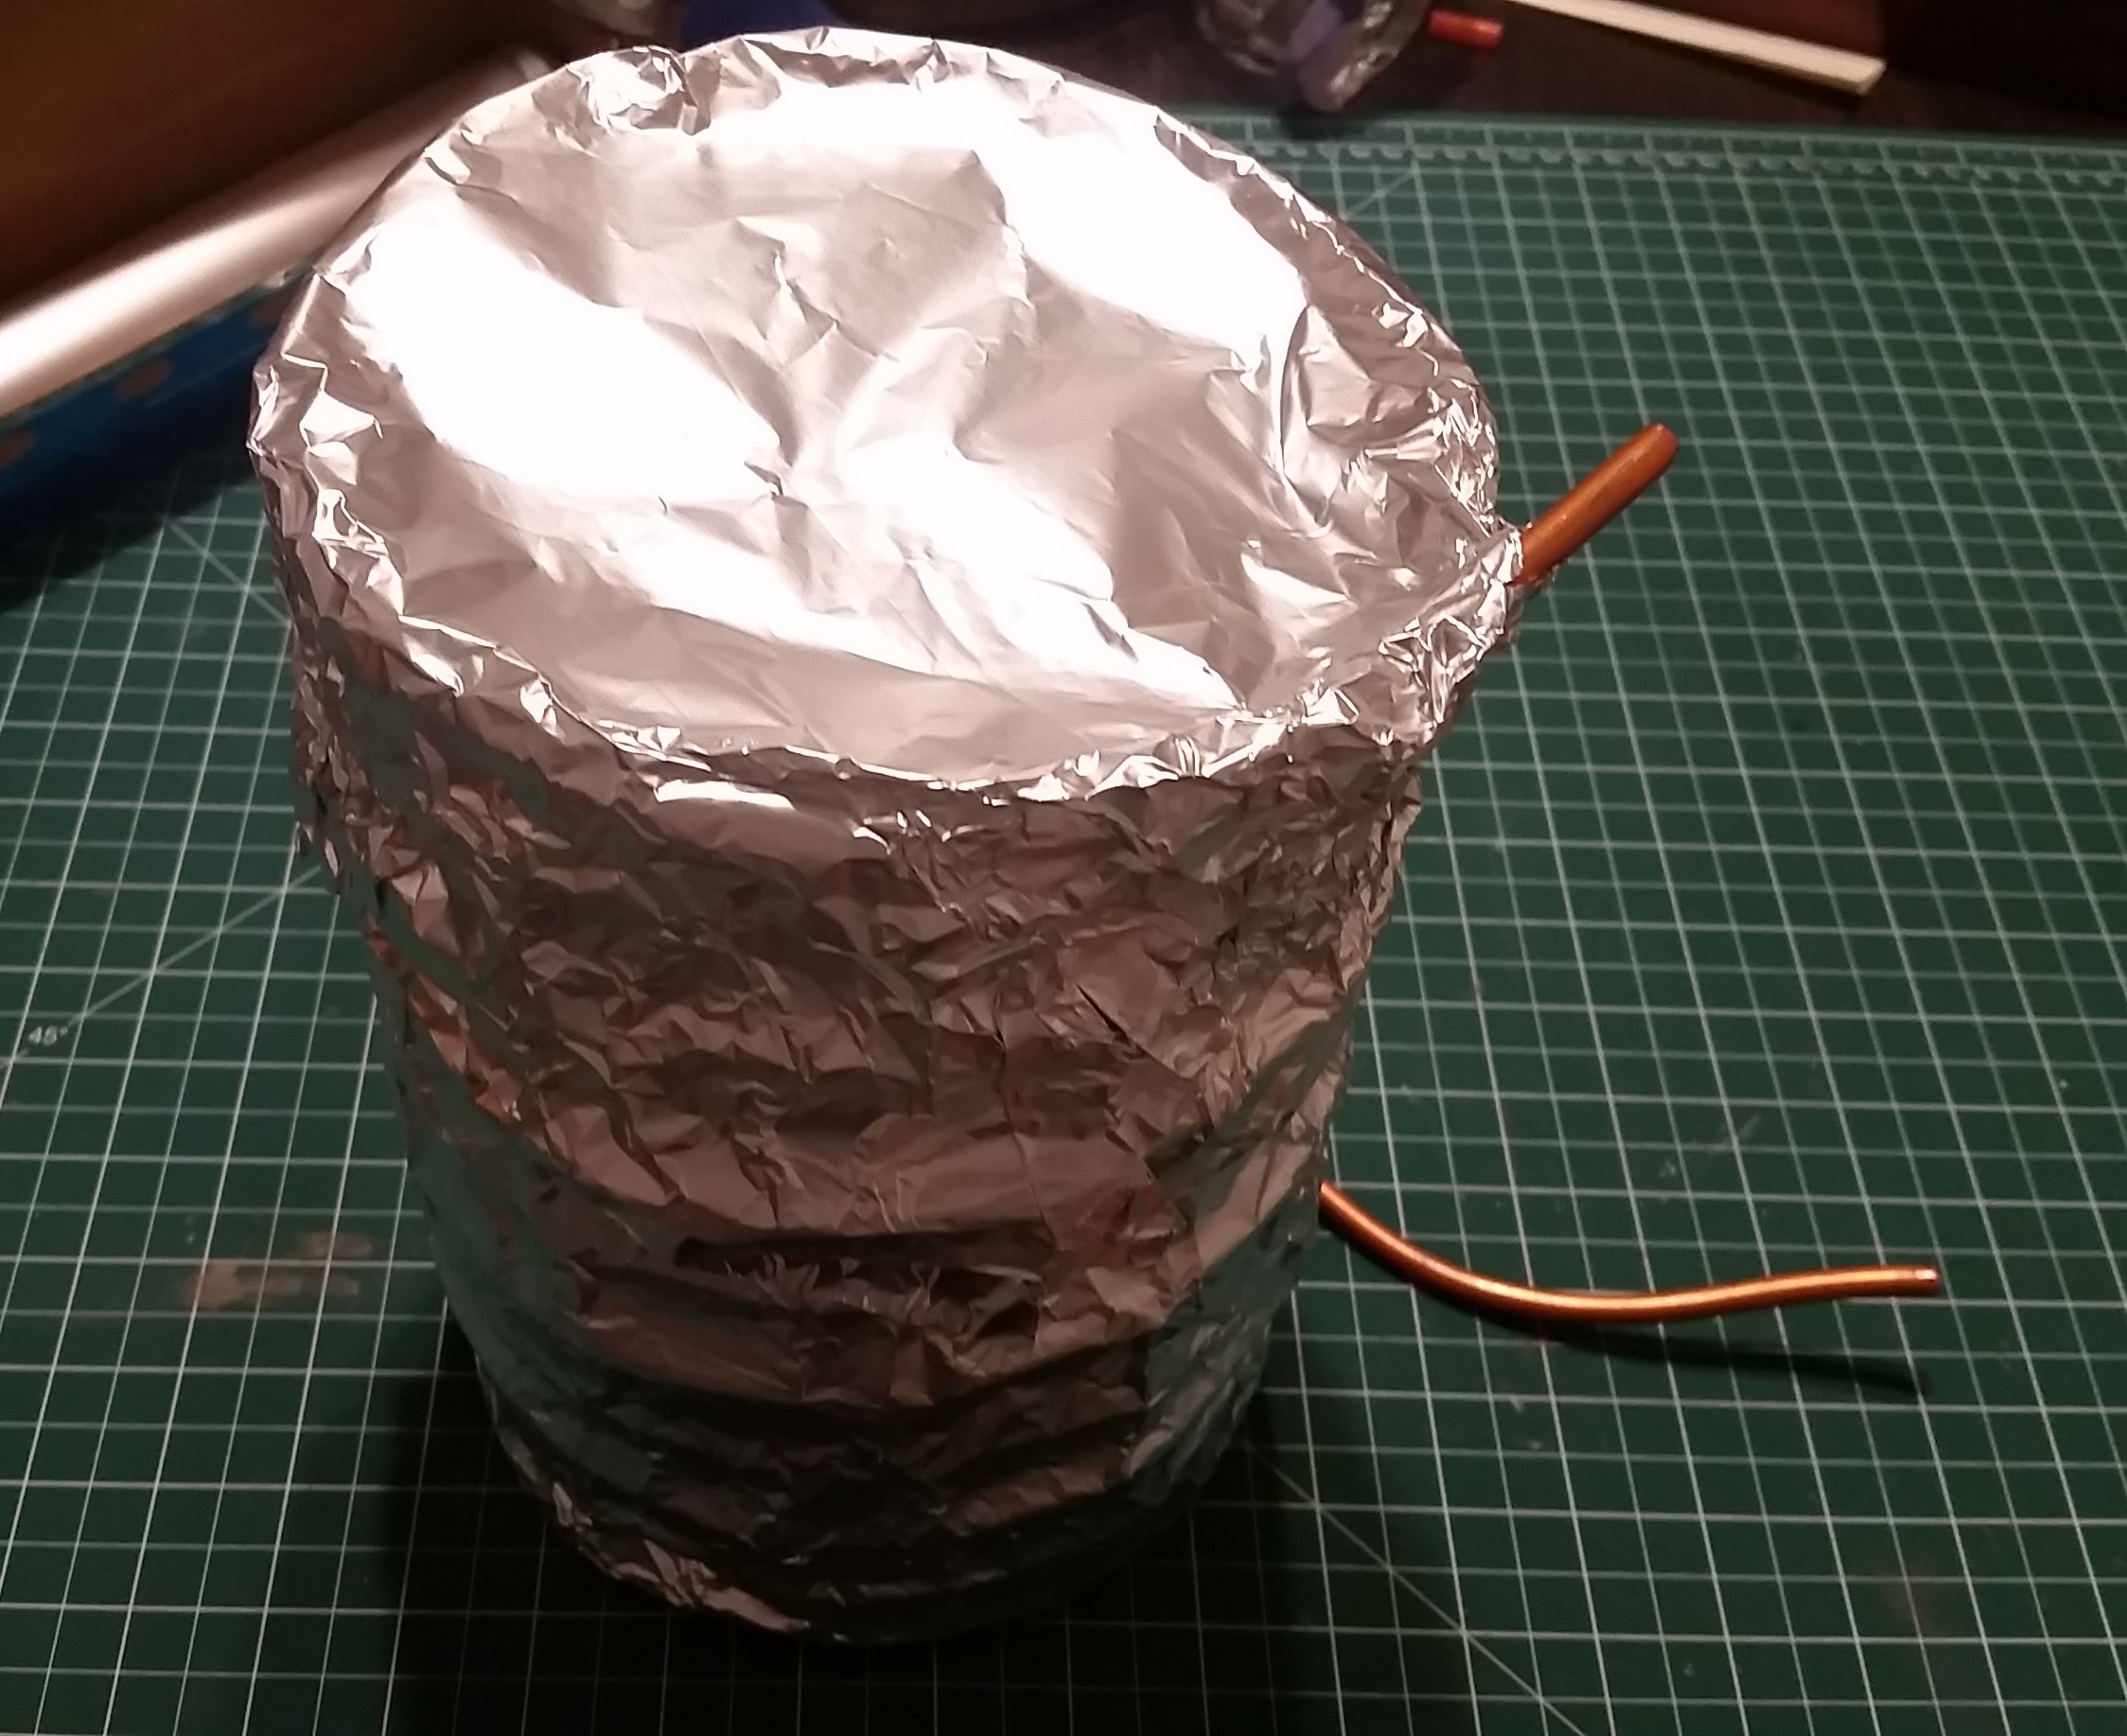
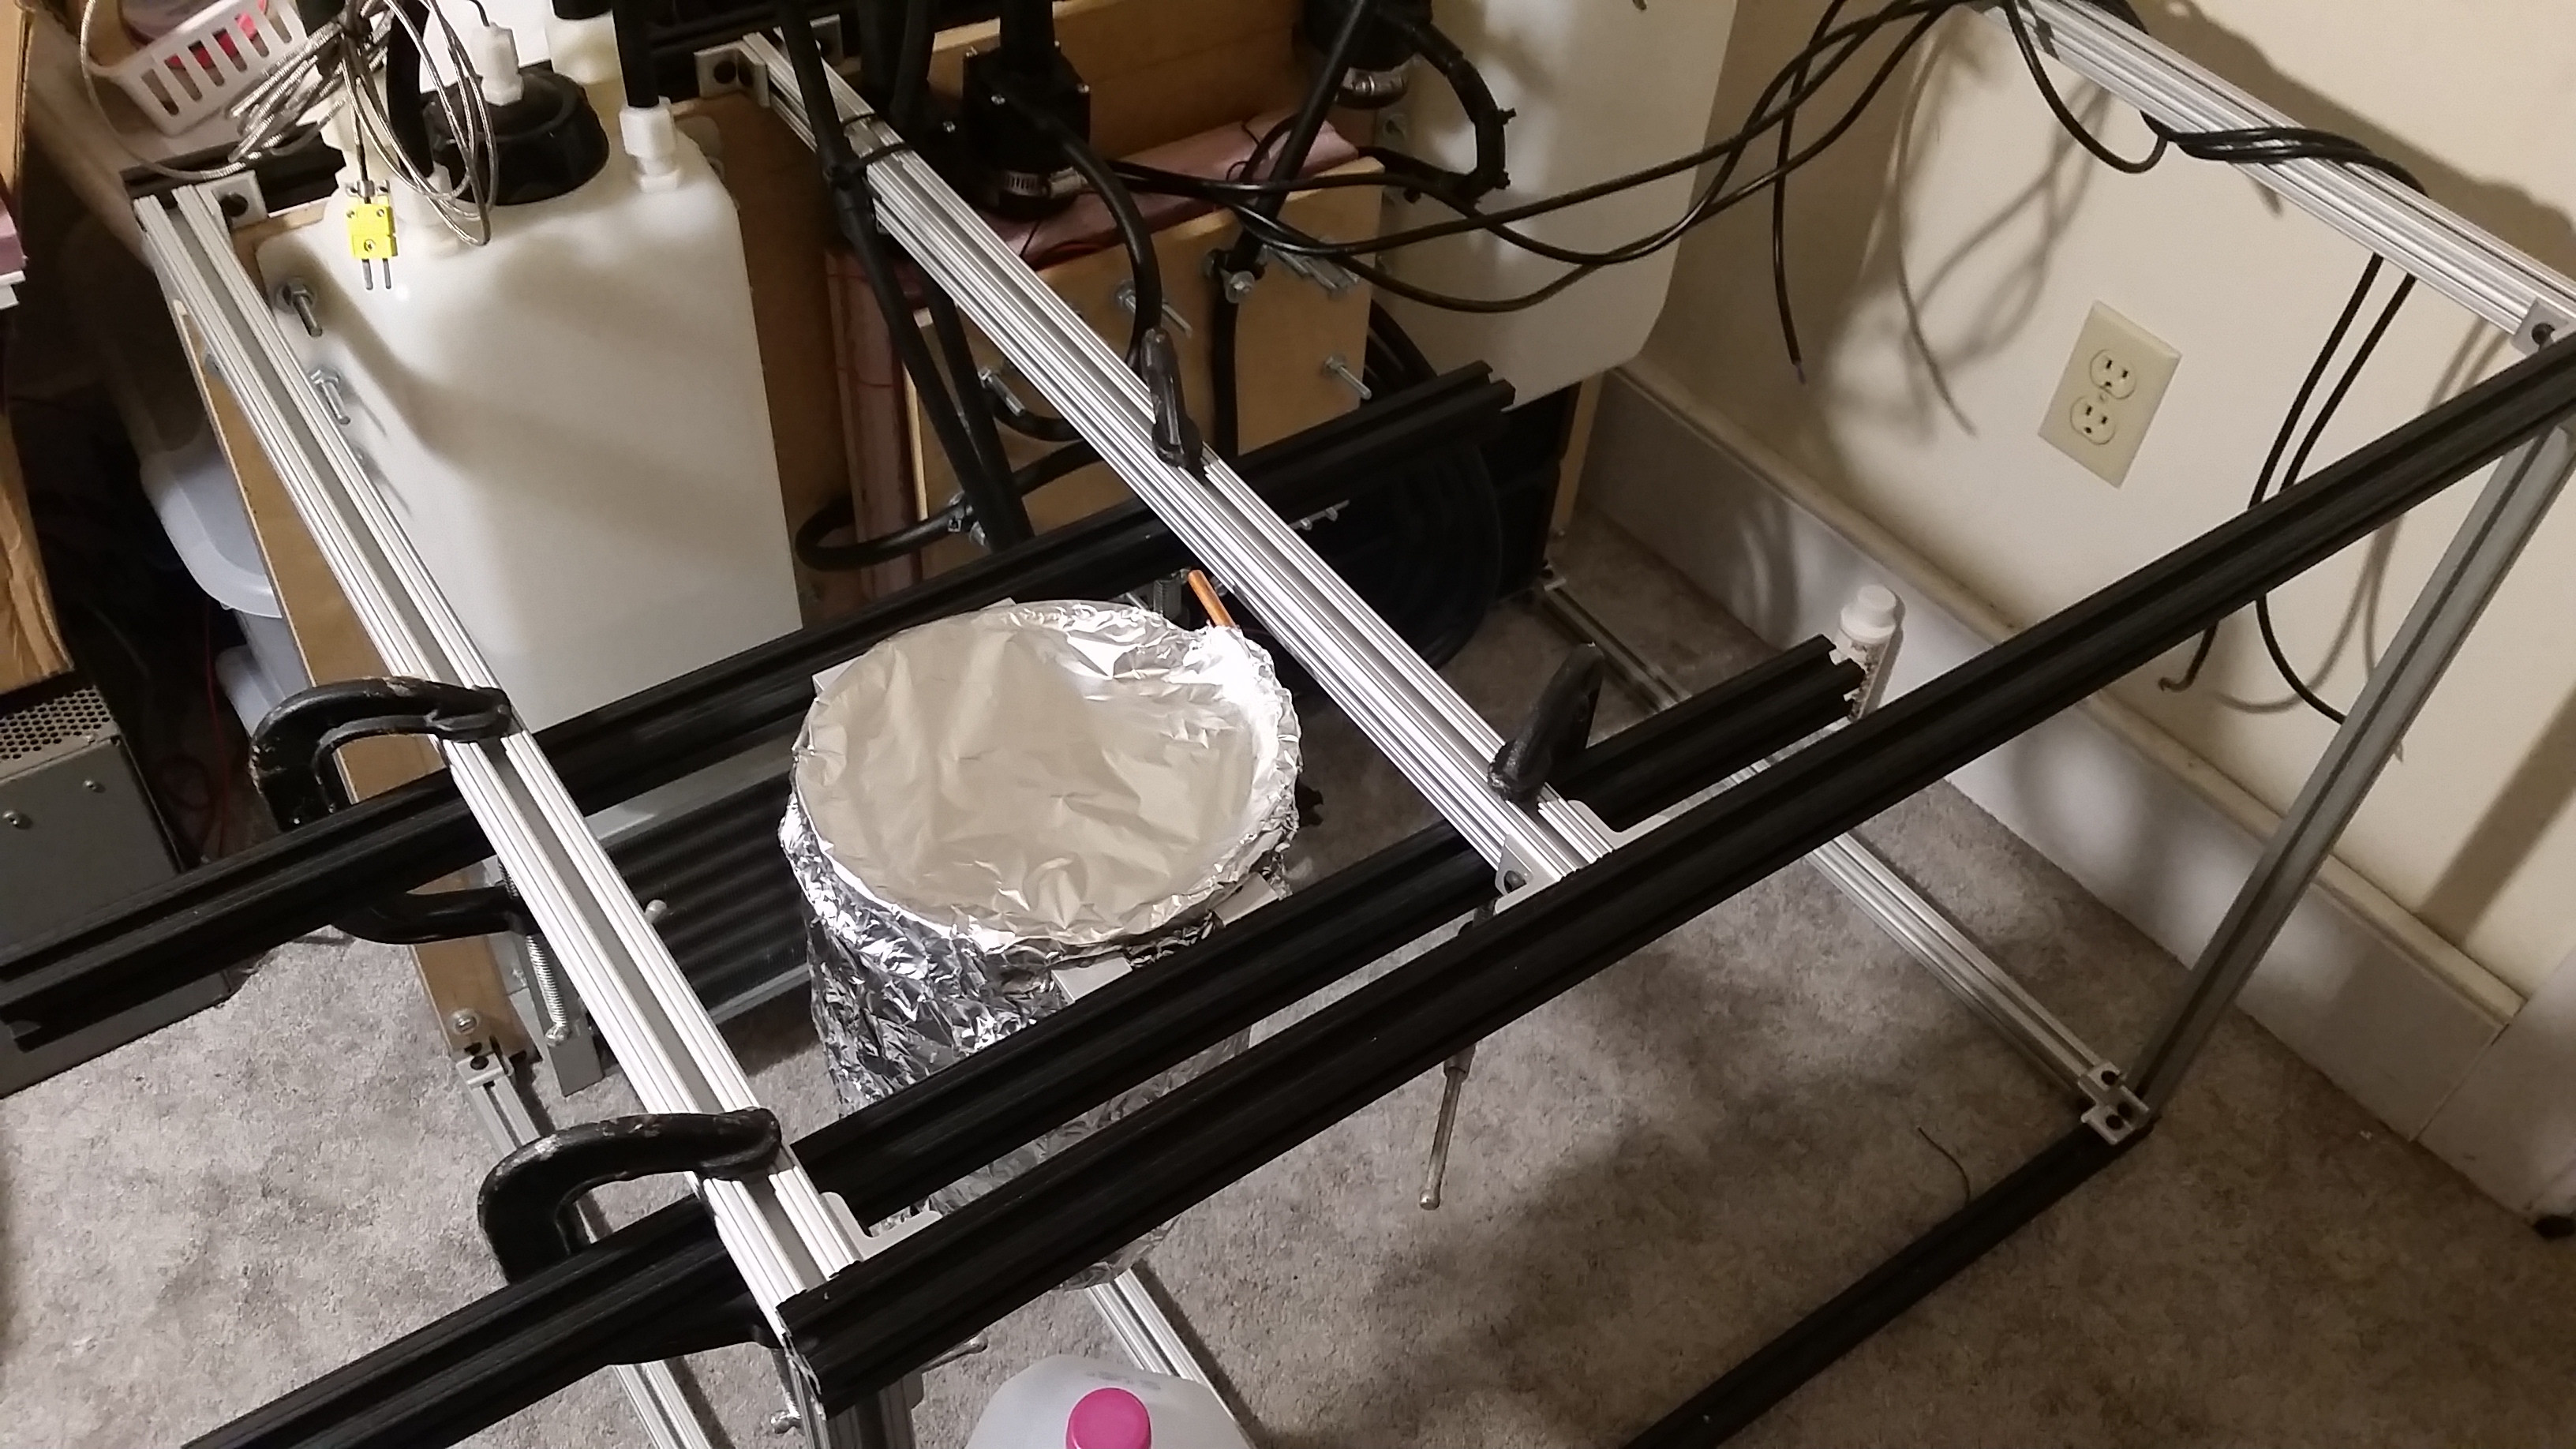
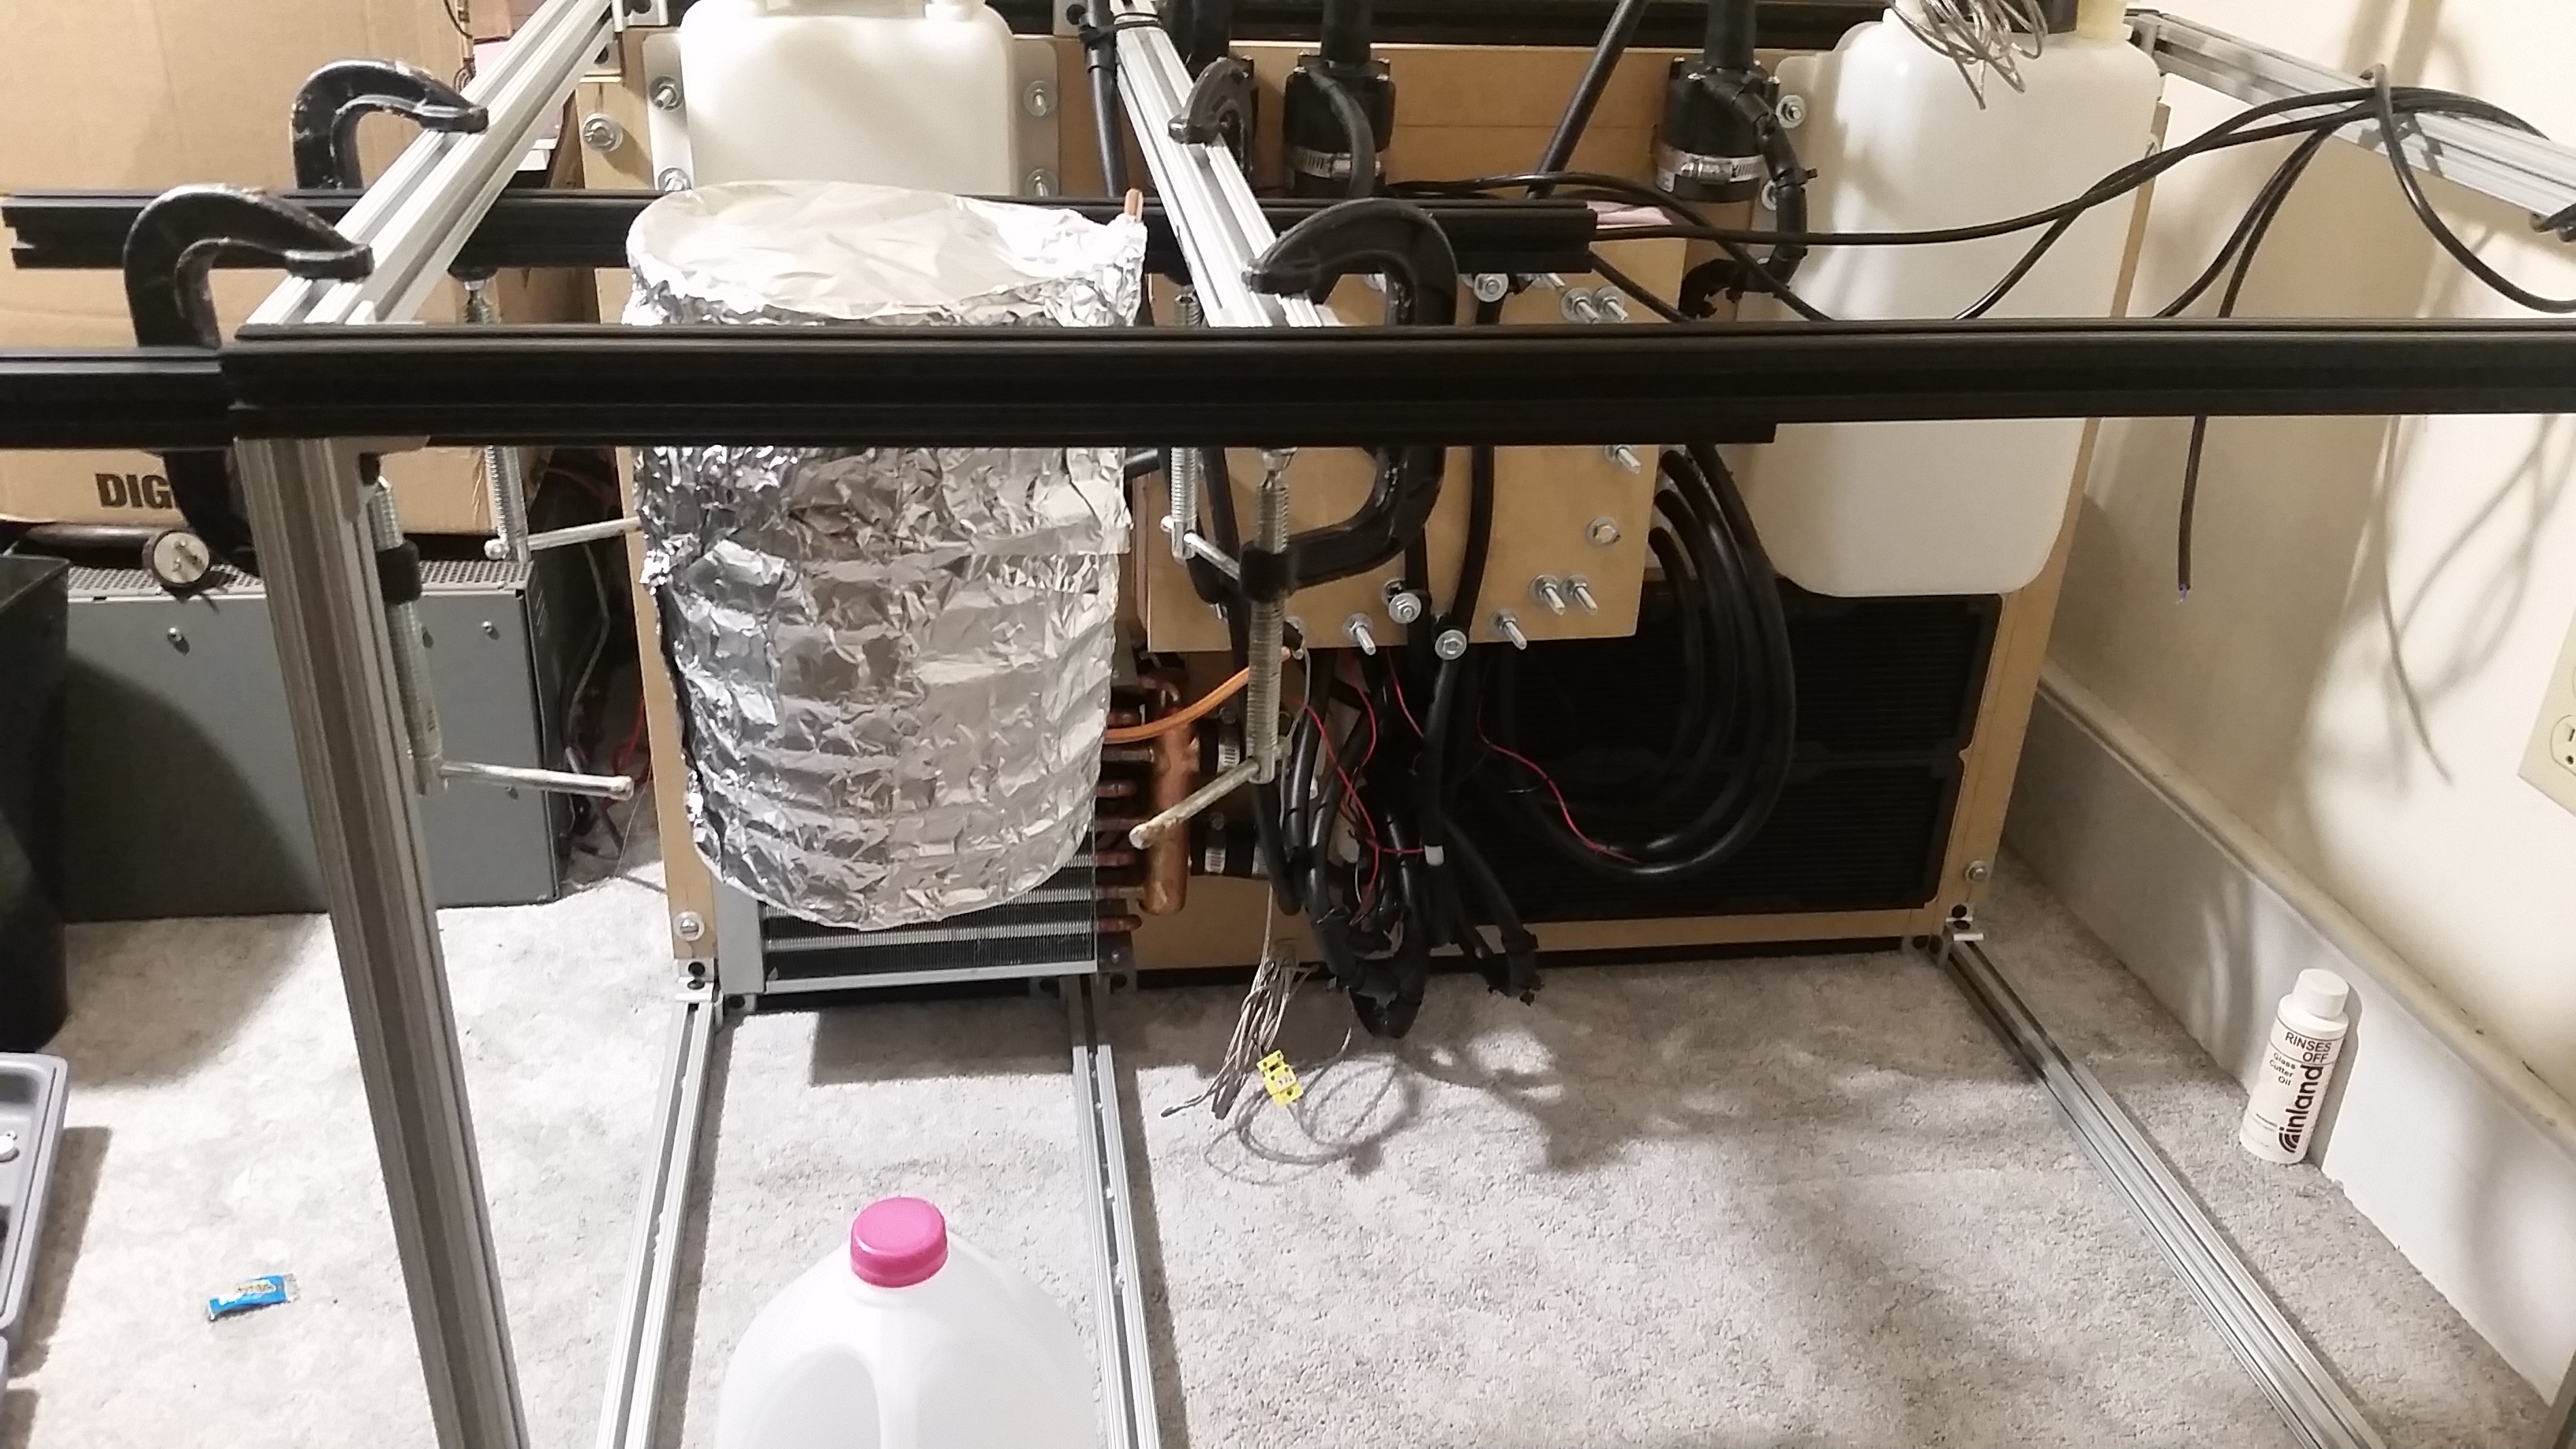
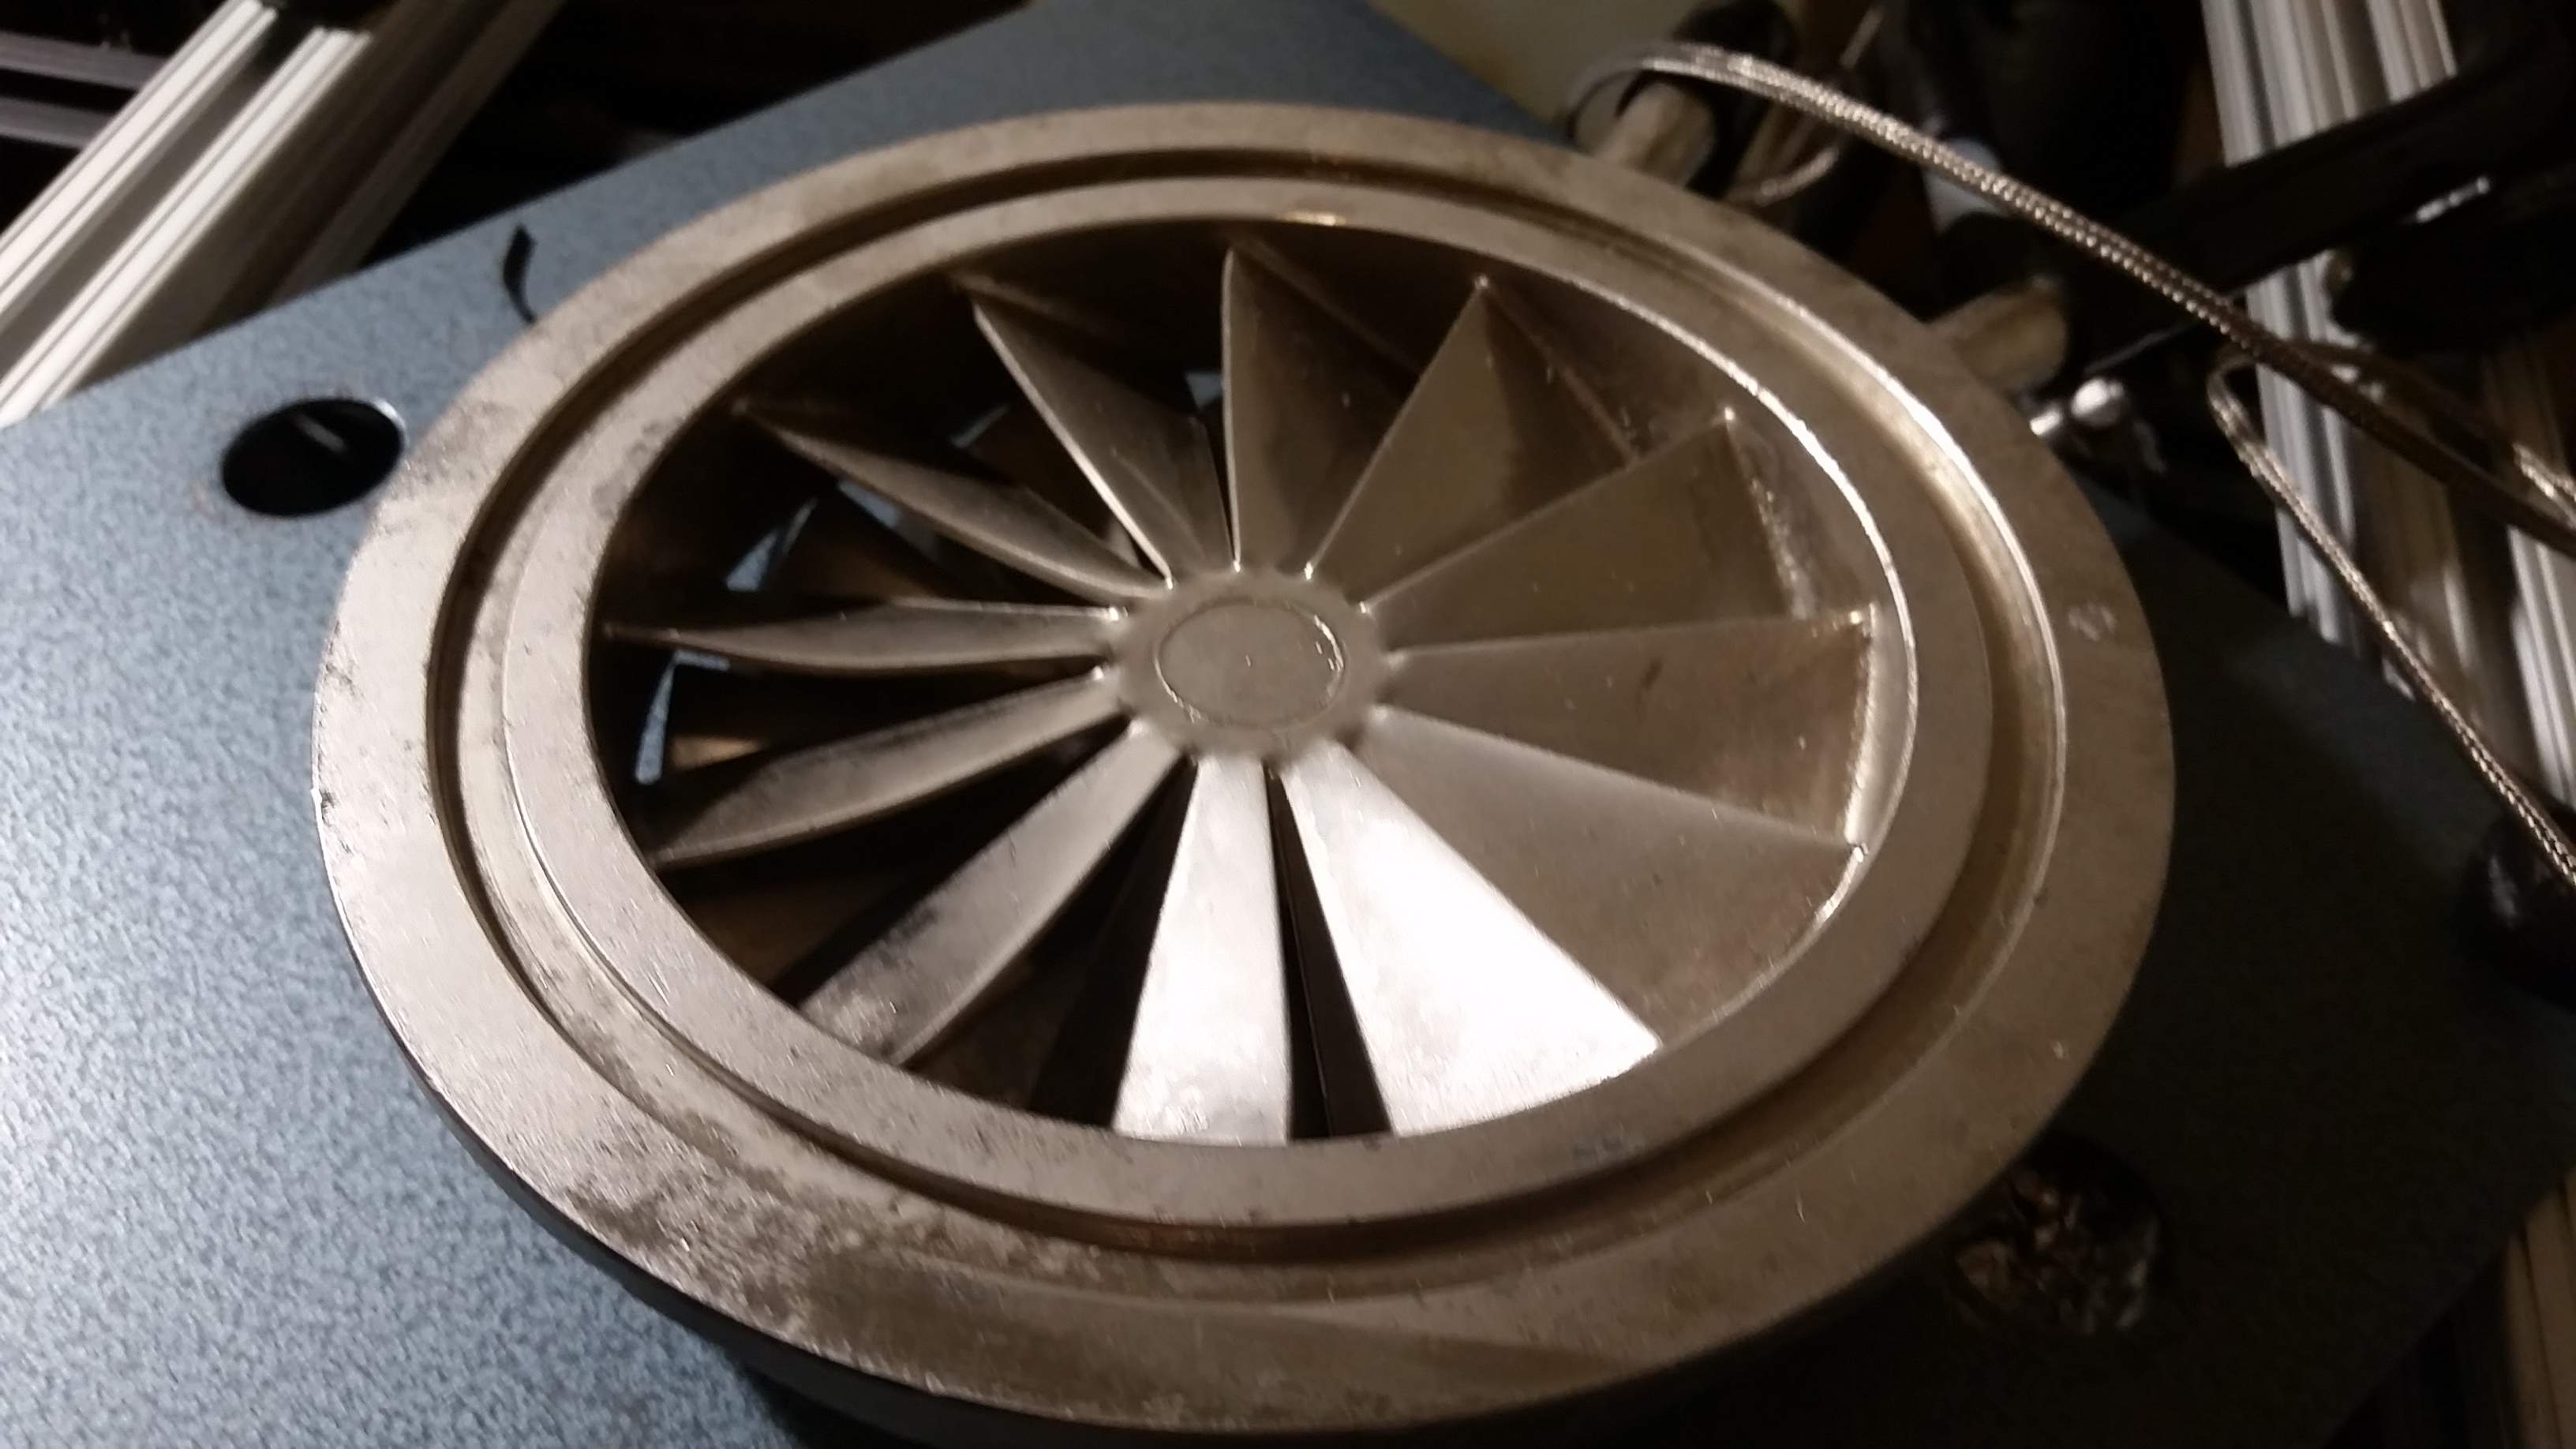
Since the cooling lines for the diffusion pump consist of 1/4″ tubing that spirals around the body, I decided to create a mock diffusion pump load with a similar coil of 1/4″ copper tubing. This was bent and shaped into roughly the same size as the cooling line on the EO4 diffusion pump, which will be the main pump that will be used. This would also help simulate the flow conditions with the diffusion pump as well, and allow me to test the primary loop flow rate more accurately. Once formed, the coil was wrapped with several layers of aluminum foil to retain heat, and covered at the top with additional foil. The bottom was left open for the heat source, which would be either a hair dryer or heat gun depending on the thermal load required.
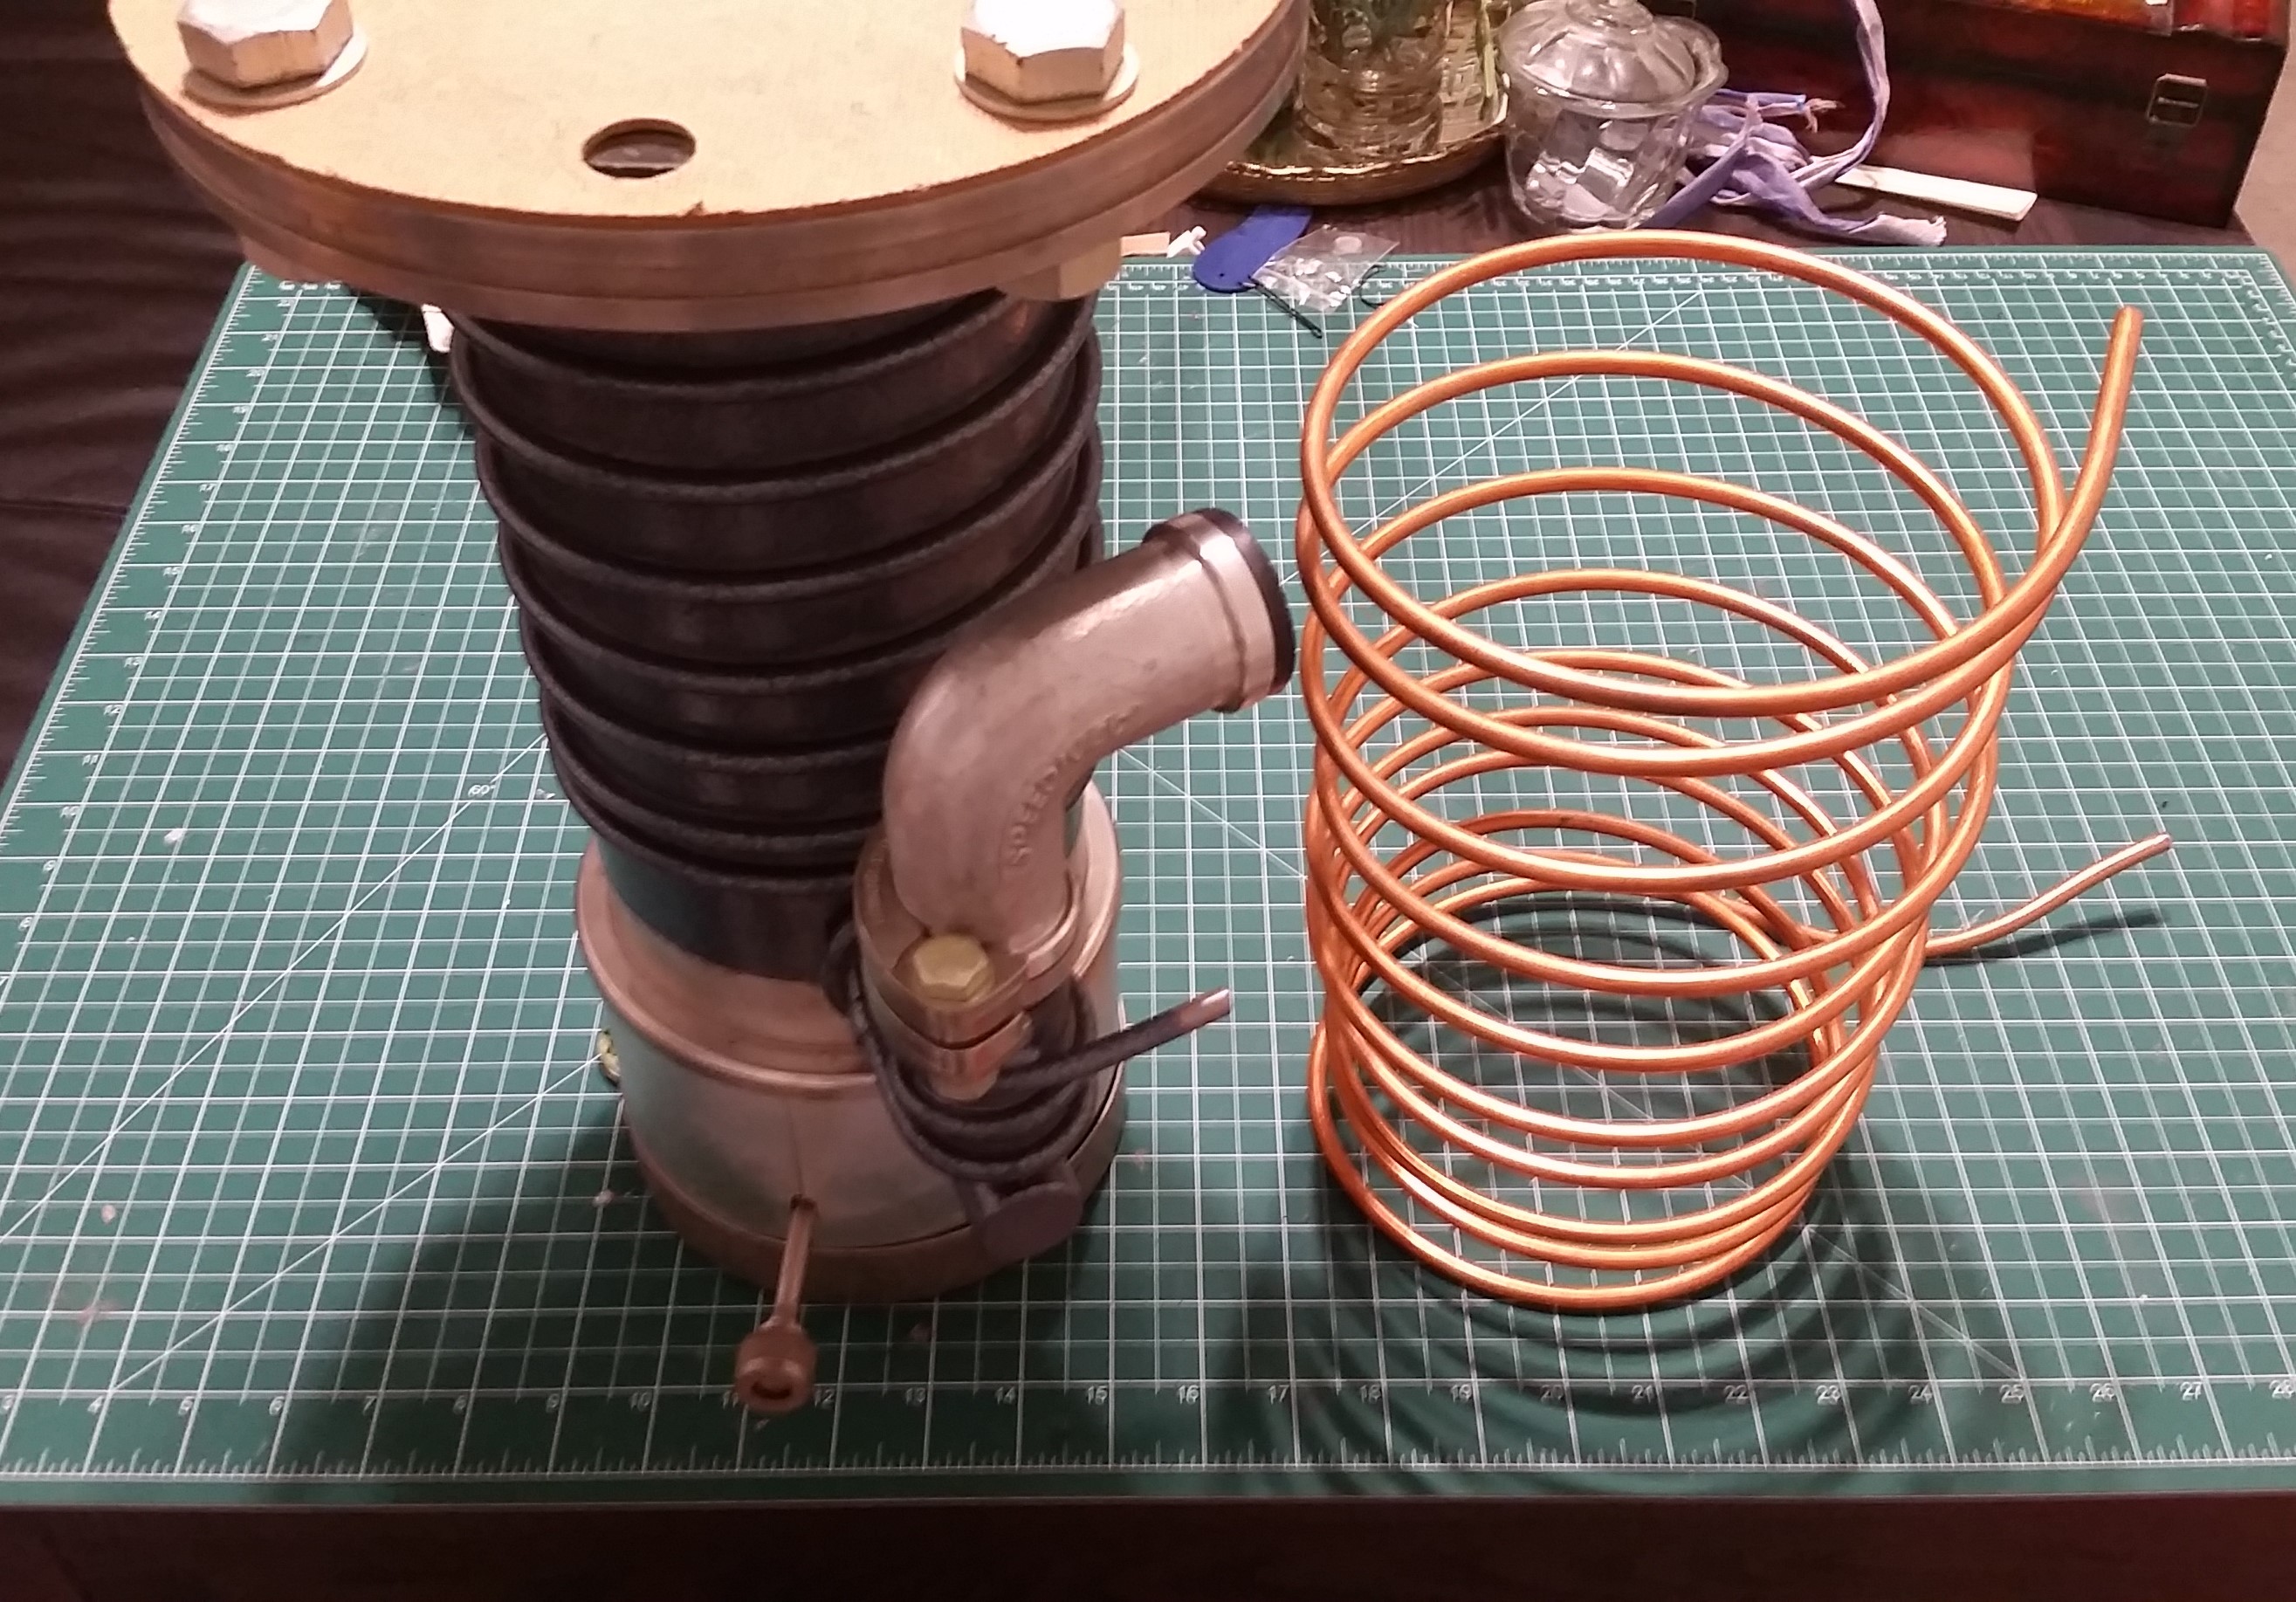
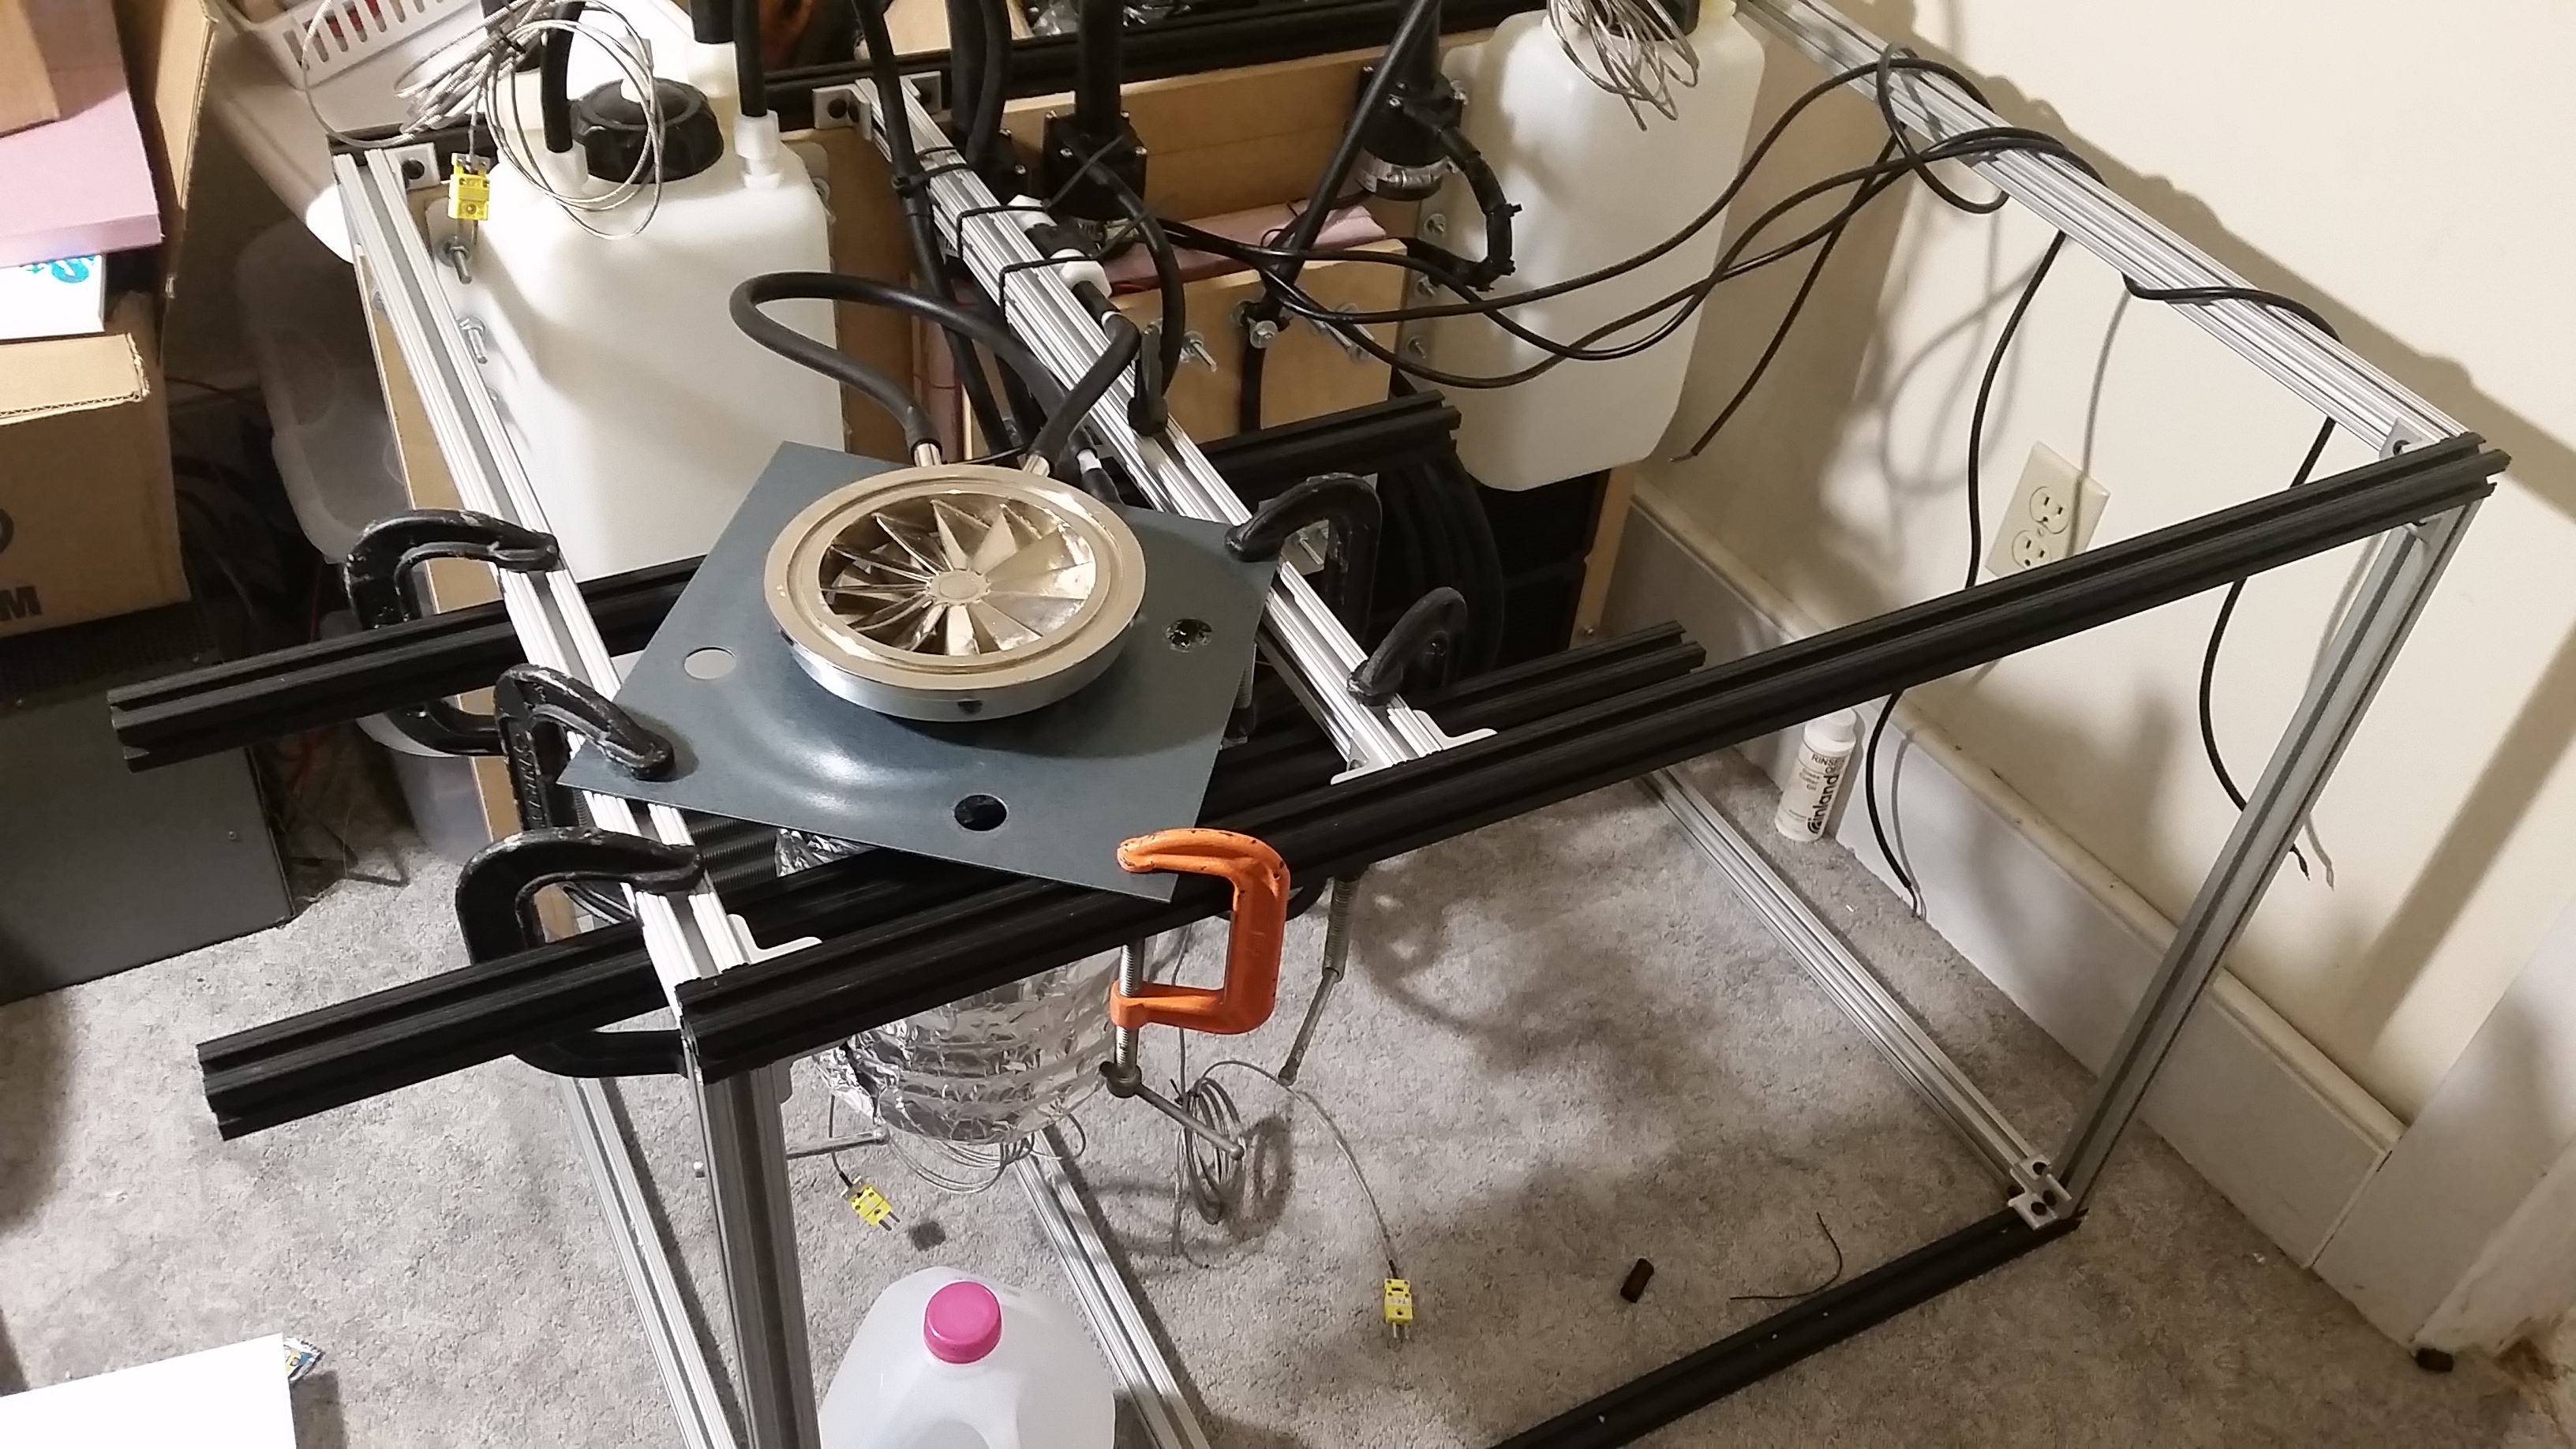
Once the coil was set, it was mounted in the same location that the diffusion pump would actually be mounted in the final setup. This was accomplished by using a few spare pieces of 80/20 clamped to the frame, with a couple of corner brackets protruding out in the middle to clamp the coil in place. On top of the coil, the water cooled baffle was placed, with a plate underneath, so that the full system flow conditions and thermal loading could be reasonably well simulated. After this, the remaining lines were run and connected to all of the appropriate inputs and outputs.
Priming the System
Once the cooling lines were run, it was time to fill up the tanks and begin priming the pumps. One gallon distilled water jugs from Walmart were purchased, as a cheap supply of water. While the final system would run with a mixture of distilled water and inhibited propylene glycol, I wanted to leave the glycol out for now since it was a bit costly, and I knew I would be wasting water troubleshooting and debugging the system in the beginning.
I quickly learned however that priming the pumps would be quite a challenge. Since the pumps are not self priming, they needed water in the system before they could properly pump. At the time I did not have a priming or transfer pump, so I decided to literally suck through the lines until water was drawn into the system (I do not recommend doing this, particularly for health reasons, especially if using an inhibitor in the system.) I found out the hard way that any air in the system would render pumping useless, since some of the loops, such as the primary loop, was getting near the limit of maximum head the pump could handle. For the short secondary loop through the peltier cold side, there was no problem getting a healthy flow of water through the system easily. For the most complex loop however, the tertiary loop, which provides cooling for the peltier hot sides, this remained a unique and frustrating challenge. The main issue was that since there were so many parallel lines, the lines would not all fill up simultaneously, and as a result, proper flow was not established. Through trial and error, I found the solution was to block off all but one of the parallel lines, and pump fluid though that loop, then block that off and move to the next loop, and then the next, until all the parallel loops were filled. I then went back and blocked off only half the lines, and ran coolant though one half, then the other, then everything at once to establish full flow in the system. While the soft EPDM rubber hosing does have some drawbacks, one of the huge benefits of using it for the cooling lines was that it is very easy to pinch and block flow to troubleshoot and prime the system.
After priming all three loops, as well as spraying water all over myself and the floor several times due to untightened hoses, it was time to finally start testing. I eventually got a proper fluid transfer pump, a cheap unit for about $8 from Walmart, which works flawlessly and has greatly improved the priming and debugging process.
Data Acquisition
Finally, the moment I had been waiting for! The pumps, peltier chiller, and fans were wired up and ready to go. Before I started the test however, I needed a way to collect data from the thermocouple sensors in the cooling system during the tests. Not only would the test be a valuable qualifier of system performance and debugging, but also would allow me to finally test the newly built thermocouple probes in the actual system. For interfacing the thermocouples, I used the 6-channel thermocouple amplifier board I previously built, which utilized an AD595 thermocouple amplifier chip to allow for accurate reading of the thermocouples. The output from the board was fed into the analog inputs of an Arduino Mega. Along with the thermocouples, I also would be monitoring ambient temperature with the DHT22 digital temperature and humidity sensor I had mounted on the thermocouple amplifier board.
I decided this was also the perfect time to start testing the control software I had been eyeing on using with the system: MegunoLink. This is a great and very powerful piece of software designed for control, monitoring, and bidirectional communication with the Arduino, or other micro-controllers. I decided to download the free trial version. After only a couple of minutes and a quick Arduino sketch, I was able to plot data in real time. In addition, the software allows you to export collected data at the push of a button to .csv files for analyzing in software such as Excel later.

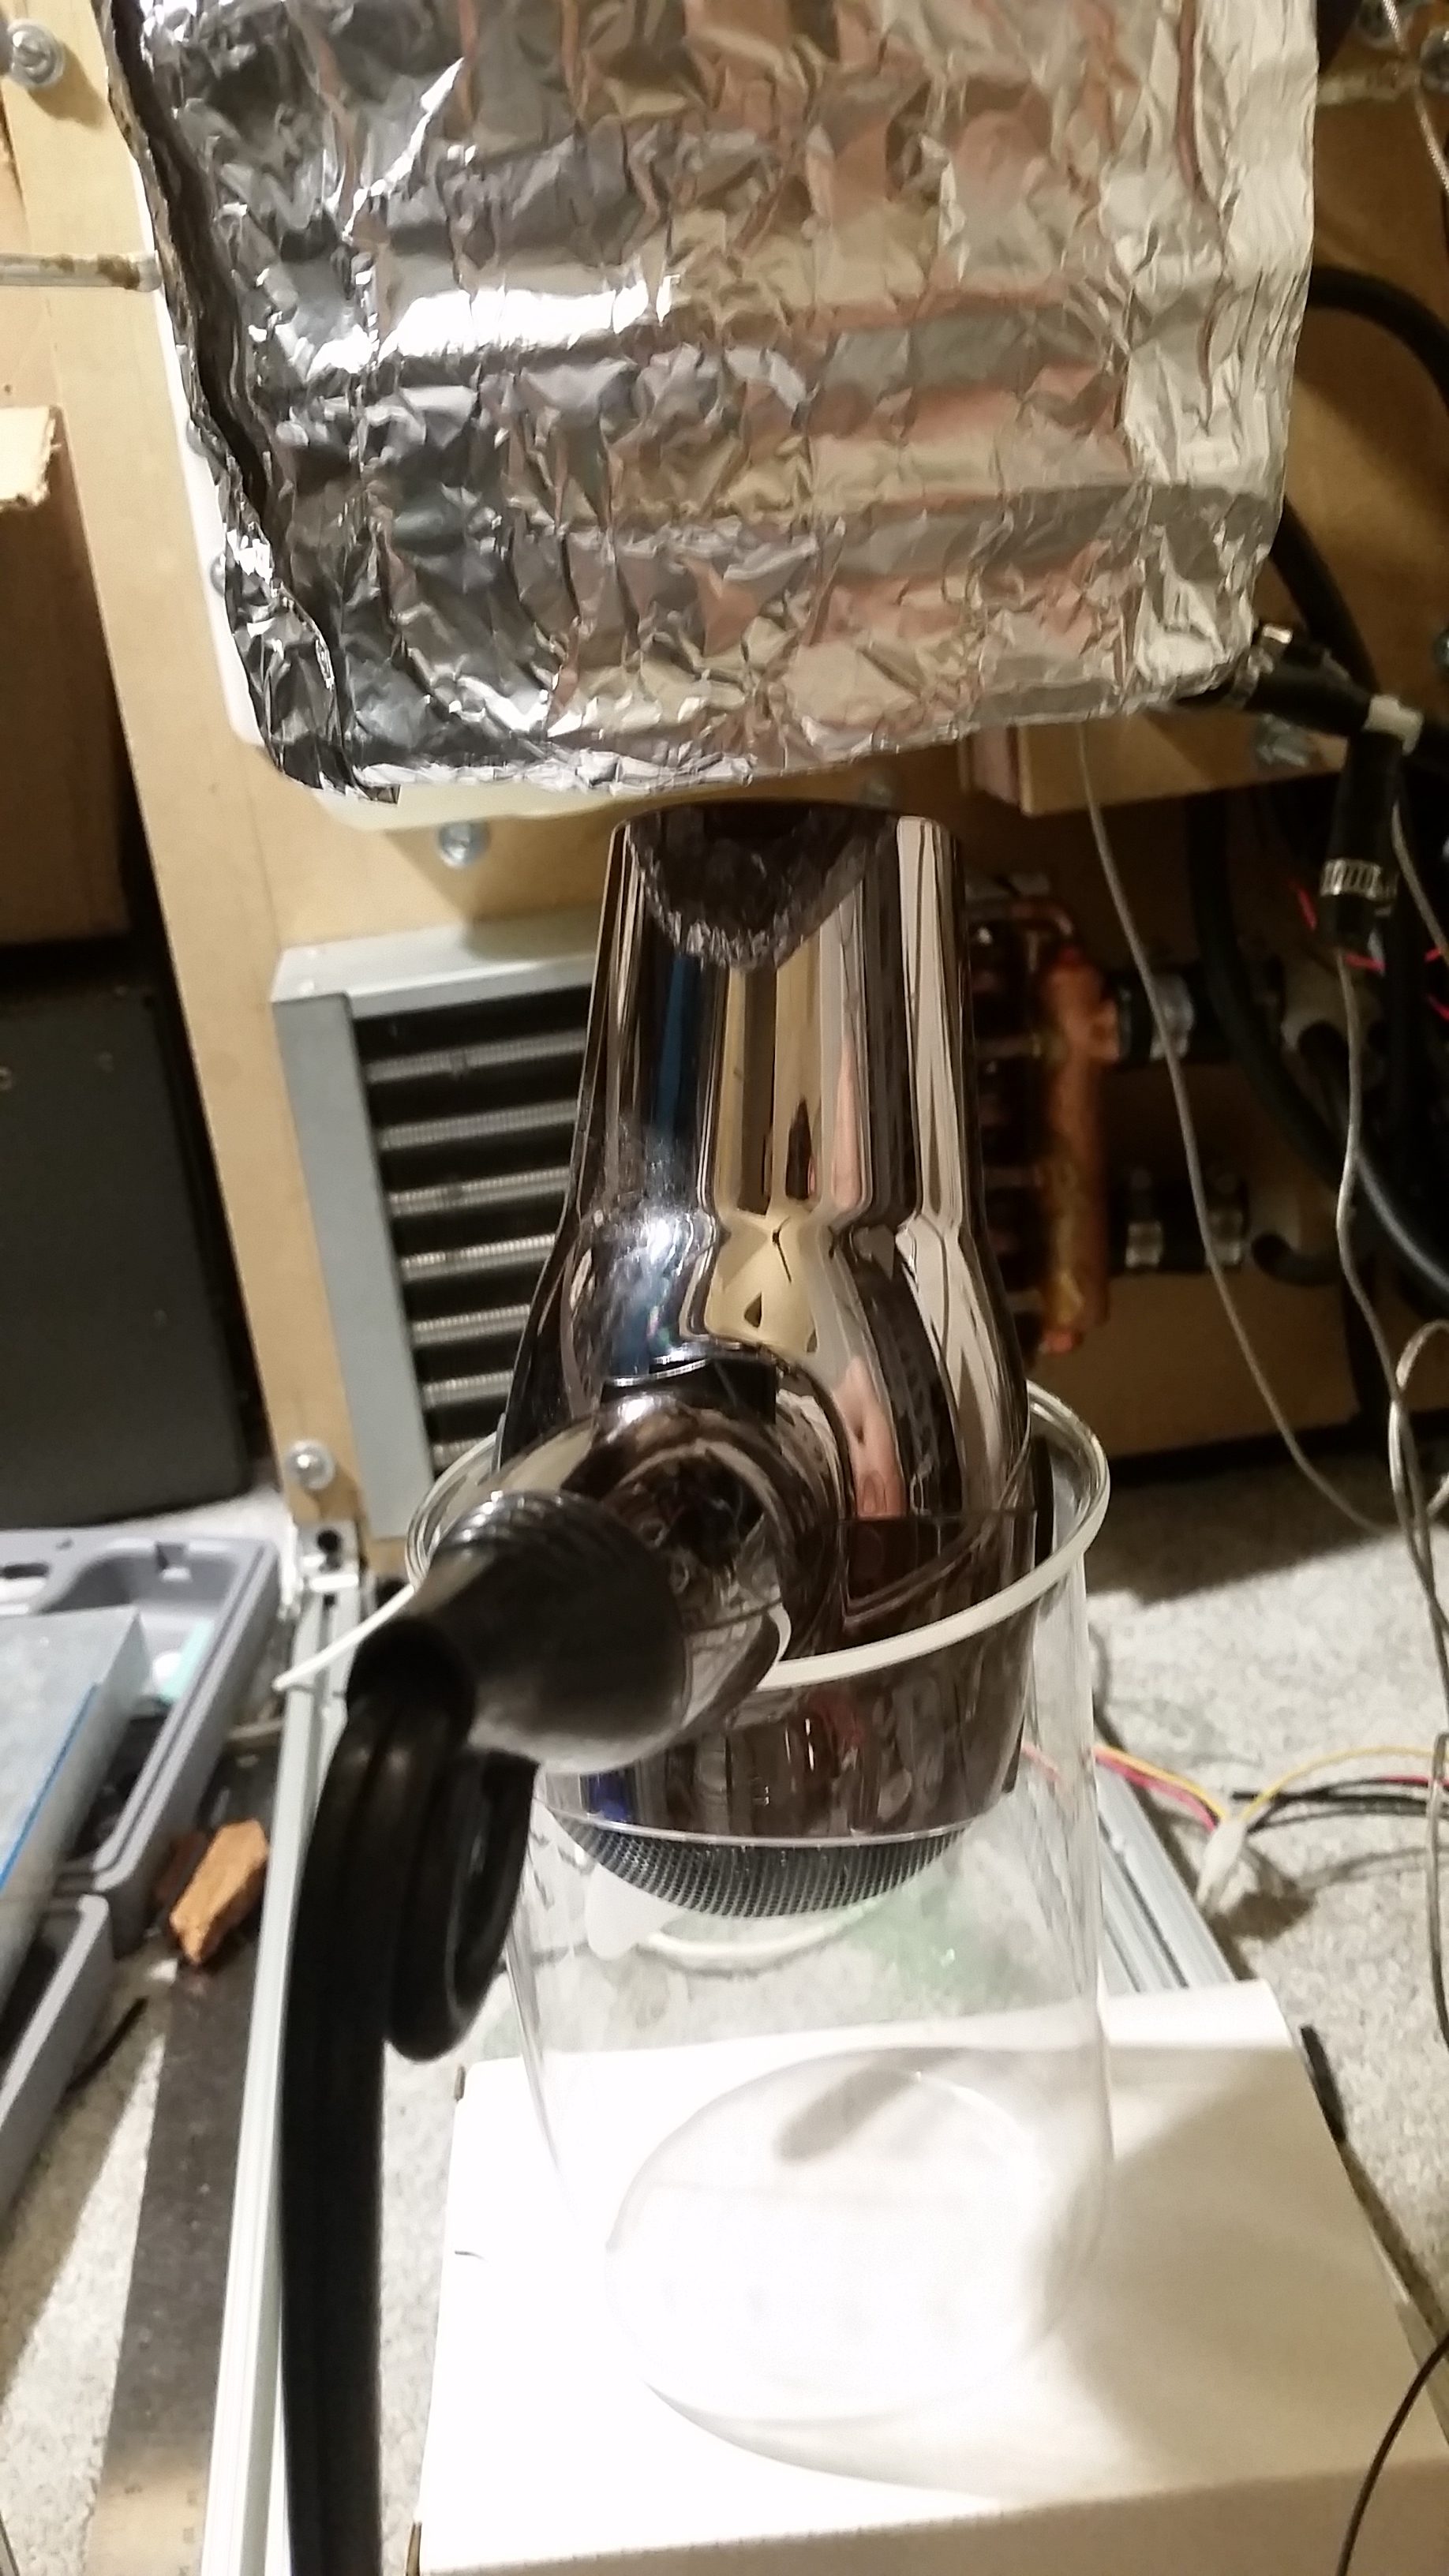
With real-time monitoring and data acquisition ready, the first tests could begin. I decided to use a hair dryer for the initial thermal load, placed under the test coil. In order to calculate all of the thermal losses and dissipation of the system, a series of small individual tests were run with each subsystem. The data for these tests is presented below.
The First Test Run
My first test included a series of steps, where I would cycle through the various systems to test response of each. The first part of the test would be to qualify the chiller. The hot side cooling loop and heat exchanger fan was turned on, and I began pumping through the cold side. After about a minute of pumping, I kicked on the peltier module. I eagerly watched the monitor for signs of changes in the peltier cold side outlet thermocouple and the primary tank. After a few minutes, the temperature started decreasing! I also noticed that the hot side thermocouple registered the temperature rapidly increased about 10C above ambient in a period of 10 minutes, and stabilized to about 10C above ambient for the duration of the test. I decided to let the peltier module run to see how long it would take to reach my target temperature of at least 15C (of course without any load at this point, just against ambient) to see if the chiller would work. After about 40 minutes, the final temperature of the tank read around 13C. Although slower than I anticipated, it showed the peltier module indeed worked! At this point, the cold side lines were beginning to condense and sweat a lot, which would require some thermal insulation later to improve efficiency.
With the temperature below my target, it was time to switch on the primary pump and start pumping coolant through the baffle and test coil, still without a test load. This was to establish the effect of ambient losses in the system against the peltier chiller. The primary pump was engaged – immediately the temperature shot up several degrees, and stabilized around 20C. Not a great sign, but this could be improved with some more analysis and tweaking. Finally, the big moment – the hair dryer was switched on, and thermal testing could begin. During this stage of the test, the temperature slowly rose up to about 30C, where it seemed to start stabilizing. Not good – my target was a max temperature of 25C with a thermal load of 1kW. After, the peltier chiller was switched off, and with the load still on, I could qualify the cooling response without the peltier. The temperature rose further – good that the peltier helped stabilize the temperature, but bad that the heat exchanger was not as effective as originally anticipated. Finally, the system was shut down, and the data was saved and analyzed.
The data was collected and plotted in Excel, but I discovered that I needed to run a few additional tests before I could quantify the thermal response of the system in this test. It was decided to run these tests and quantity the response of each loop, then revisit the data to make better sense of what was going on.
Primary Loop Thermal Response Test
The first of these individual tests that was run was with just the primary loop. By looking at the response of just this loop, I could qualify the heat load input into the system from the hair dryer, the losses due to pumping the coolant through the loops, and finally the thermal dissipation of the heat exchanger. Below is the resulting graph plotted from the collected data:
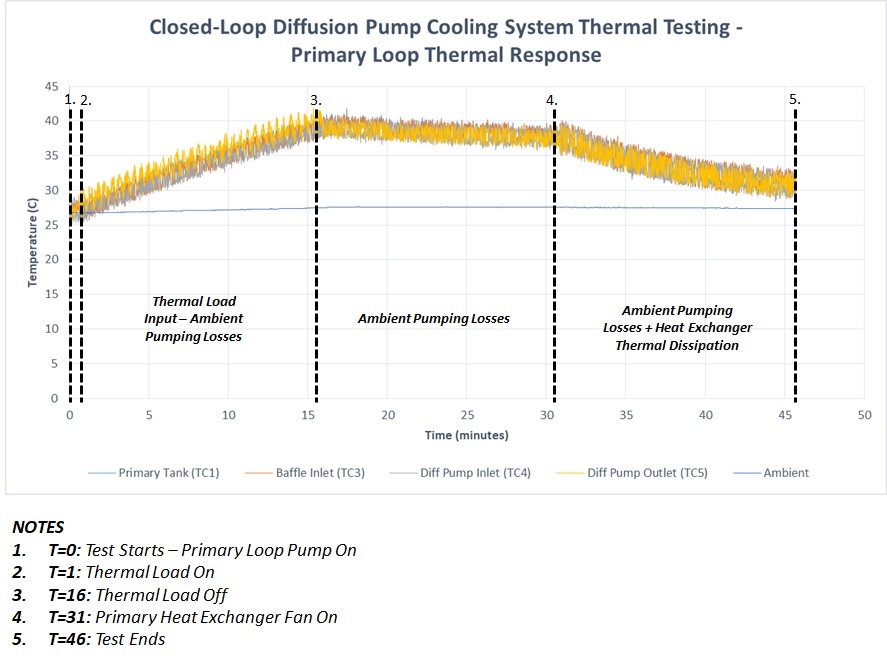
The hair dryer was first turned on, with the primary pump on. The chiller was not used at all, and the heat exchanger fan was off. The temperature rise between points 2 and 3 of the above graph thus represents the thermal load input minus the losses due to pumping the coolant through the system against ambient. Since I know the start temperature, the end temperature, the coolant used, the amount of coolant in the system, and the time required for the change in temperature, I could calculate the thermal input, which includes losses due to ambient. Using the following equation:
Q = c x M x dT
where Q is the energy required in Joules, c is the specific heat of the liquid in J/g C, m is the mass of the liquid in grams, and dT is the temperature difference in degrees C. In my case, the liquid is water, which equals 4.186 J/g C. The amount of water in my system is about 1.25 gallons, which equates to about 4732 grams. The dT is 13.9 degrees C for the first section of the test between section 2 and 3. Using this, I can find that the resulting energy required is 175319 Joules. Now, using the next equation:
t(s) = Q x P
where t(s) is the time in seconds, Q is the same number of Joules calculated above, and P is the power in Watts, and solving for P, we get:
P = t(s) / Q
Since I know the time between points 2 and 3 is 15 minutes, or 900 seconds, and that Q is 175319 Joules, the resulting input power to the system, minus ambient losses, is 306 Watts. In order to figure out the input power from the hair dryer, I must figure out the losses due to ambient, and add it to this number. This is accomplished between points 3 and 4 in the above graph. In this case, the heat load is shut off, and just the circulating pump is run. Using the same process as above to calculate power, with a dT of 2.5 C in 15 minutes, I find the losses due to pumping against ambient through the primary loop is 55 Watts. Therefore, I can now establish that the total heat input from the hair dryer is 361 Watts. As a reference, the hair dryer is rated for 1875 Watts total, which means the actual delivered heat efficiency into the system from the hair dryer is about 19.25%.
Finally, in the last stage of testing, between points 4 and 5 in the graph, I can figure out the total thermal dissipation of the heat exchanger plus ambient losses, then extract out the dissipation of just the heat exchanger. As calculated above, with a dT of 6.5 C in 15 minutes, I find the total losses for both ambient pumping and the heat exchanger to be 143 Watts. Subtracting out the 55 Watts calculated in the previous section, the heat dissipation due to the heat exchanger is 88 Watts. Based on the input power of 361 Watts from the hair dryer, and the total thermal dissipation of the loop of 143 Watts, I can estimate the total excess power that is not handled by the system to be the difference of these two, or 218 Watts.
Below is a table with the final calculated numbers summarized for the primary loop dissipation test:

As can be seen, the primary loop is grossly under spec. The primary heat exchanger was rated for 7kW of thermal load with an airflow of 1750 CFM. While the fan was rated for this airflow, it was very apparent that it was not actually providing nearly enough to be effective at even dissipating the relatively small heat load generated from the hair dryer. If the primary loop cannot handle keeping such a low-power load below ambient, then there was no way it could withstand the full power of a large diffusion pump.
Peltier Hot-Side Loop Thermal Response Test
The next set of tests involved quantifying the thermal response of the tertiary loop, which is used for cooling the peltier hot sides. This test was run with all systems on except the thermal load, however only thermocouple data from the hot side loop was analyzed. Like the previous test, this test was run in three distinct sections, to allow for the calculation of the peltier hot side load thermal input, the ambient thermal losses due to pumping the coolant through the system, and the heat exchanger power dissipation. The final graph is provided below:

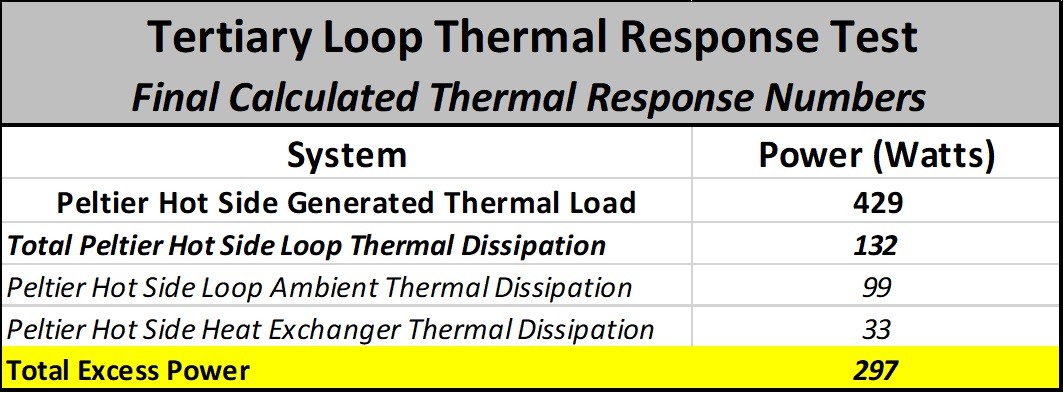
Like the cold side of the cooling system, the hot side also has a capacity of 1.25 gallons. With the same process as described above, I can calculate the same response of this loop. For the first phase of the test, between sections 2 and 3 of the above graph, the thermal load generated from the peltier module hot side can be found, which includes losses from ambient due to pumping in the loop as well as the heat exchanger dissipation. With a test cycle of 10 minutes, and a dT of 9 C, the thermal load is 297 W. This represents an excess in power that is not handled by the system. After this, between section 3 and 4, for 10 minutes the peltier module and secondary heat exchanger were shut off, to establish ambient losses. With a dT of 3 C in 10 minutes, this totaled about 99 W. Final, for the last 10 minutes between sections 4 and 5 of the graph, the heat exchanger fan was switched back on, to measure the total loop thermal dissipation. For a dT of 4 C, the thermal dissipation equaled about 132 W. With these numbers, the individual responses can be determined. For the total thermal load generated from the peltiers, 297 W from the first section and 132 W from the total loop losses are added together for 429 W. Since both ambient losses and the losses of the heat exchanger and ambient combined are known, then by subtracting the power dissipation from the third section of 132 W from 99 W from ambient, the heat exchanger dissipation can be found to be 33 W. A table of the final numbers can be seen below:
As with the first loop, the peltier hot side loop is severely under spec. The thermal load dissipation of the heat exchangers is rated for 1kW combined, and the target is to keep the loop at ambient. Both of these objectives were not met. The poor response of this loop also could explain the slower response of the peltier chiller, in which the cold side temperature is ultimately determined based on the hot side temperature for a given load. After this point, it became clear that the under-performance of both loops had one thing in common: both used the same cooling fan. Although the cooling fan was rated to 1750 CFM, the actual static pressure, or its ability to push air through a heat exchanger, which represents a pressure load, seemed to be practically non-existent, and very little air was actually moved through either heat exchanger, which explains why their responses were not far off from the ambient losses. Armed with this knowledge, the graph from the initial cycled testing could be reevaluated.
Revisiting the First Test Run Data
With the above subsystem analysis, I could now better analyze the data from the very first initial run. Below is the generated graph from the first round of testing:

As can be seen, several combinations of cycling was run in this test. The peltier module was first qualified, just by itself against ambient, then against primary loop losses with the primary loop pump activated, then with the heat load, and finally just the heat load.
For the first portion of the test between points 2 and 3 in the above graph, the peltier chiller module was turned on, along with the peltier loop pump, and the entire hot side pumping and cooling system. Over the course of 40 minutes, the peltier dropped the temperature of the tank from ambient at 27C to about 13C. From this, it can be estimated that the peltier provided 116 W of cooling power, against ambient. On the hot side, the temperature quickly climbed about 10C over the course of 10 minutes, and stabilized to 10C above ambient for the remainder of the test. From this, it can be estimated that the excess power of the hot side loop is 330 W, since this temperature rise includes both ambient losses and thermal dissipation from the heat exchangers.
For the next portion of the test, between points 3 and 4, the primary loop pump was turned on, circulating the coolant through the loop, without the thermal load on. In a period of 10 minutes, the temperature of the coolant rose from about 15C and stabilized around 20C. After this period, the heat load was switched on, with all systems fully engaged. This occurs between points 4 and 5 in the above graph. Over the course of 25 minutes, the temperature rose 10C from its initial point of 20C, and stabilized around 30C. This equates to an excess of 132 W that is not handled by the system. Finally, between points 5 and 6, the peltier chiller was switched off to see the effect of just the heat exchanger. Over the course of 15 minutes, the temperature rose 7C to a final temperature of about 37C, for an excess power of 154 W.
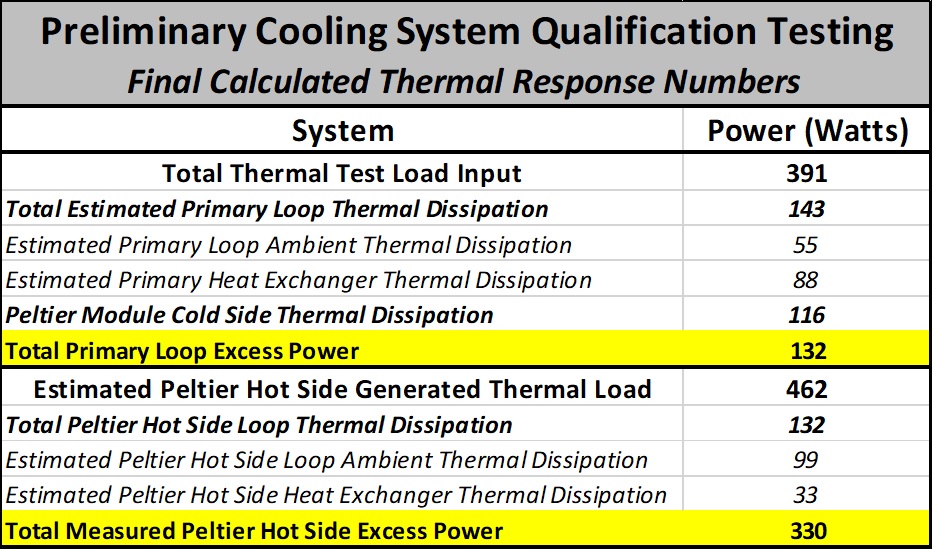
From the above numbers, and the previous tests, the thermal response of the system can be calculated and estimated. For the primary loop, the peltier provided an initial thermal dissipation of about 116 W. With the heat load on, with all systems engaged, and excess power of 132 W was measured. Using the estimated thermal dissipation of the primary loop from the previous test of 143 W, the total input of the load can be estimated to be about 391 W. This is very close to the input measured in the test qualifying the primary loop losses, and the extra thermal input could be attributed to the higher ambient temperature at the end of the test. Below is a summary of all the numbers calculated for this test:
System Improvements
With the preliminary test runs and analysis complete, several decisions needed to be made to greatly improve the system response, and bring it up to spec. The primary loop was spec’d for about 7kW of thermal dissipation. The peltier chiller was spec’d for about 300-400W of thermal dissipation. And the tertiary loop was spec’d for about 1kW of thermal dissipation. None of the loops met spec during testing, although it was shown that the peltier chiller could reach the desired temperature required. However, the final target temperature could not be maintained with all of the inefficiencies of the system in its current configuration. With the data, testing, and observations, the resulting key points were determined to be necessary to implement for improving the system:
- The original fans needed to be removed, and replaced instead with fan banks consisting of multiple high flow, high static pressure rated computer fans to the primary and secondary heat exchangers.
- Additional fans needed to be added around the system to promote further heat dissipation as required.
- Full foam thermal insulation needed to be added to the cold-side lines to prevent condensation and increase thermal efficiency.
- Foam insulation needed to be added added to the primary tank to increase thermal efficiency when the temperature drops below ambient.
In addition, several features were decided to be added to the system to help improve control and feedback during operation:
- Adding two extra flow meters to the system – one for the secondary loop, and one for the tertiary loop, for both system feedback monitoring and interlocking.
- PWM control of all three pumps needed to be implemented for better control and optimization of the system during operation.
Finally, a couple of days after the testing was completed, I noticed that the water in the primary cooling tank had started to turn an orange-ish color – only could mean rust at that point. However, all I had in my loop was copper and 316 stainless steel, both of which are compatible in that galvanic corrosion should not occur with non-contact metals. However, it turned out that my water cooled baffle, which I thought was stainless steel, was actually just ordinary steel that was plated! A quick magnet test confirmed this – the magnet stuck right to the baffle. Besides the fact that it is just terrible engineering to make a critical water-cooled high vacuum component out of steel, this was a huge setback, in that while I could use it with a large amount of inhibitor, I would have to use more than I originally planned, greatly reducing cooling efficiency. As a result, due to the fact that the inside of the baffle was so rusted, I decided to remove this component from use, resulting in the redesign of the adapter plates to use my much larger 8″ baffle, which would increase the cost of the system. This created a new requirement going forward:
- Replace the original baffle with the larger 8″ baffle, and redesign the adapter plates for mounting with the pump and chamber.
Going Forward
With the major problems identified in the system, improvements have already been started, and plans have been made to continue with the next level of testing. Foam insulation was added to the cold side lines to prevent sweating and increase thermal efficiency. Insulation was also added to the back of the primary tank to help protect the MDF baseboard from water damage due to sweating as the coolant chills. The new flow sensors were added to the remaining two loops, and a preliminary PWM control circuit has been tested and verified with the Arduino and pump motors for better flow control, using the flow sensors as feedback. Before the next round of testing can begin however, I decided that it would be best to assemble and program the control system, and mount it to the table so everything could be wired, ready, and more neat, with the system closer to its final iteration. I was able to salvage a nice computer casing from recycle to use it has the housing for the entire control system. It is large enough to easily accommodate all of the power supplies, control boards, and sensor input boards, and is the perfect low-cost solution for this system. In the next coming blog posts, I will be discussing the control system build, as well as the next round of testing with the cooling system. Once these two key support systems are finished and qualified, then the real fun will begin with the high vacuum chambers!