OVERVIEW
High vacuum system engineering involves numerous complex interactions and mechanisms that make problems in system design and operation unique. In order to better study and predict system performance for high vacuum pumping conditions, simulations can be performed. Molflow+ is a free and extraordinarily powerful Monte Carlo simulation code developed at CERN by J.L. Pons, R. Kersevan, and M. Ady that is a standard in the accelerator community for high vacuum pumping simulations in the molecular flow regime. Using the software, system engineering performance can be predicted, and the design verified. Simulation results cover pressure within the system based on pumping speed, outgassing loads, and component geometries. Pressure profile curves for the system have also been generated, and effective speed at the chamber inlet has also been verified. In addition, molecular trajectories have been generated to determine average molecule interactions in the system during operation. Three different case studies are looked at, in order to compare the effects of various levels of system preparation, from a brand new, unbaked setup, to a fully baked, pumped, and outgassed system.
MODEL PREPARATION
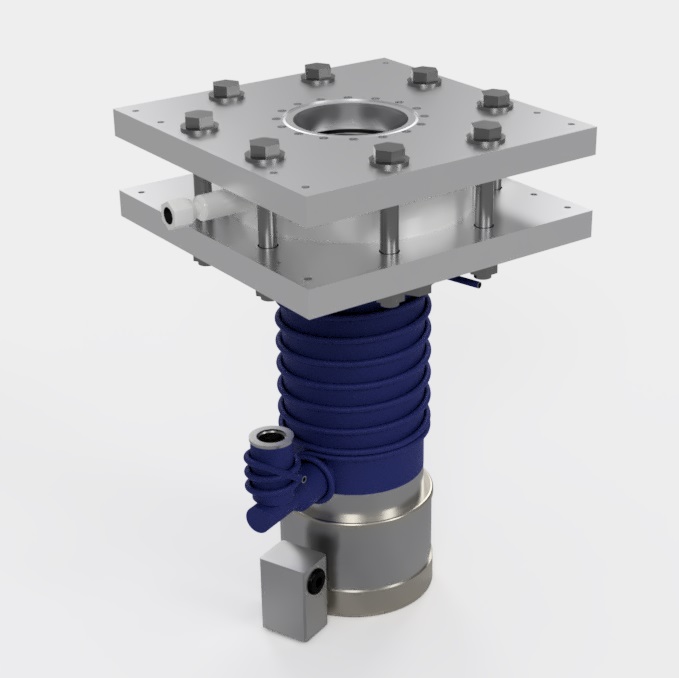
In order to run simulations in Molflow+, a proper input file must be configured and generated. Molflow+ allows user to import .STL files for simulations, in addition to creating custom geometries in the software itself through the user interface. For the following simulations, a simplified model was generated, with proper load parameters applied to the related facets. The model input and simulations are also set up to look at the high vacuum pumping assembly ultimate pressure blanked off at the inlet port. The first step of the process is to utilize the pre-existing final CAD model of the Integrated High Vacuum System diffusion pump assembly. The full assembly model is as follows:
Because of simulation times and memory requirements needed, the model should be simplified as much as possible to provide on the basic required geometries necessary for simulating molecular flow conditions in the system during high vacuum pumpdown. The bolts, nuts, and hardware was first stripped from the model. Since the diffusion pump speed is already known at the inlet, and therefore is what is seen at the bottom of the diffusion pump adapter plate, the diffusion pump was eliminated from the model. This pumping speed will be applied to the appropriate facet in Molflow+ later.
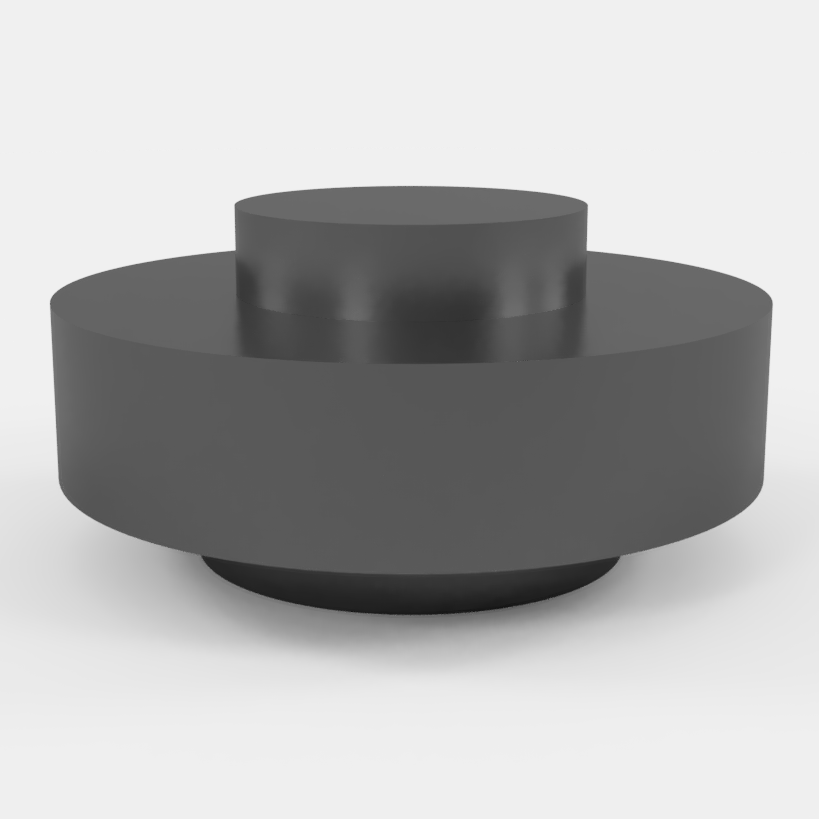
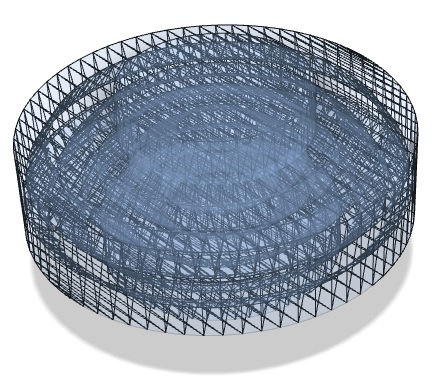
In order to create the proper .STL geometry for simulation, the model was further reduced to creating the remaining internal geometry of the adapter plate and baffle stack. Due to the way that Molflow+ runs simulations, simple solid initial CAD models can be used. With refinements, the resulting geometry looks like the following:
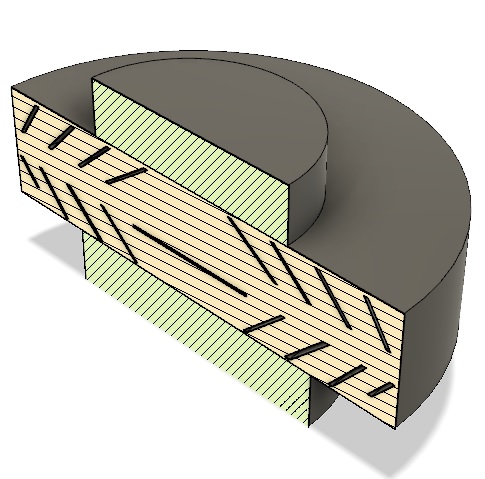
In this model, only the internal geometry space of the components are modeled. In order to model the baffle, the central cooling line was removed, and the internal cavity space of the baffle was modeled by extruding a solid cylinder in CAD of the same internal baffle dimension, and subtracting out the baffle fins from the solid cylinder, resulting in the internal space of the baffle:
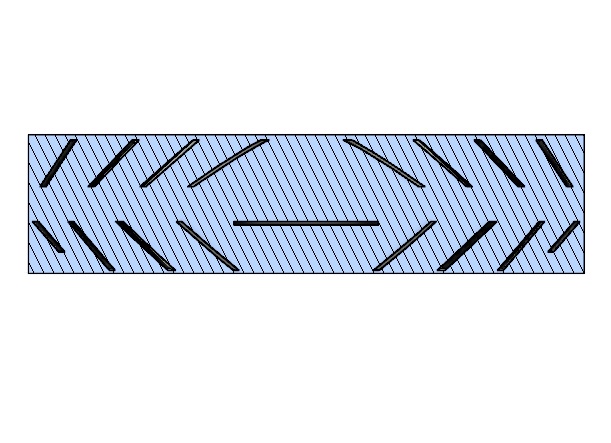
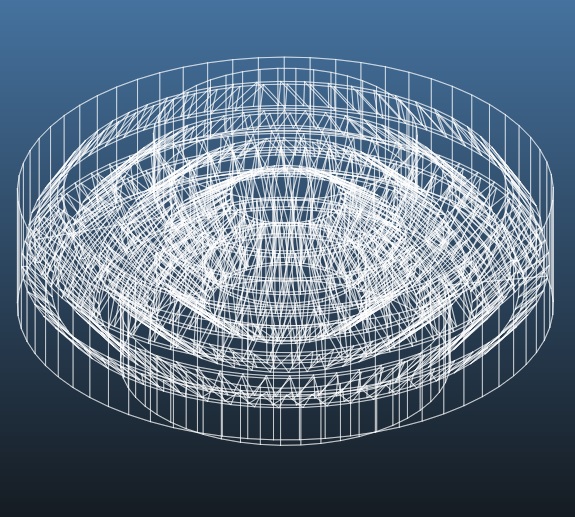
After the simplified model was complete, the .STL file and appropriate mesh were generated. Because of the small size and relatively simple geometry of the pumping setup, only low mesh settings were utilized, giving more than sufficient resolution for the final simulations with reasonable run times:
Because the CAD software used, Fusion 360, generates only binary STL files, the original exported file must be converted to an ascii STL file to be used with Molflow+. The final resulting refined and collapsed Molflow+ model is as follows:
VACUUM PARAMETER FACET ASSIGNMENTS
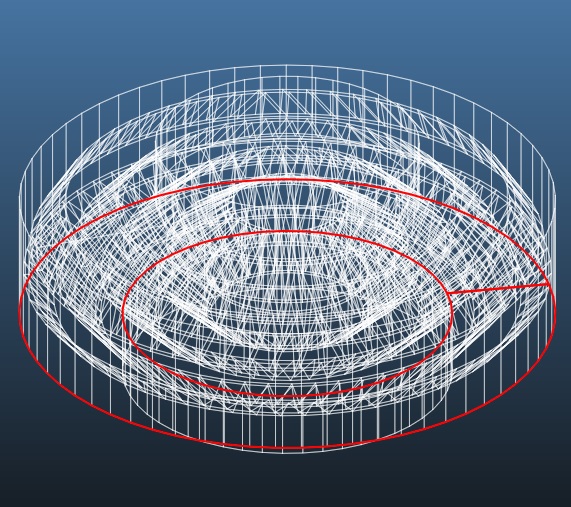
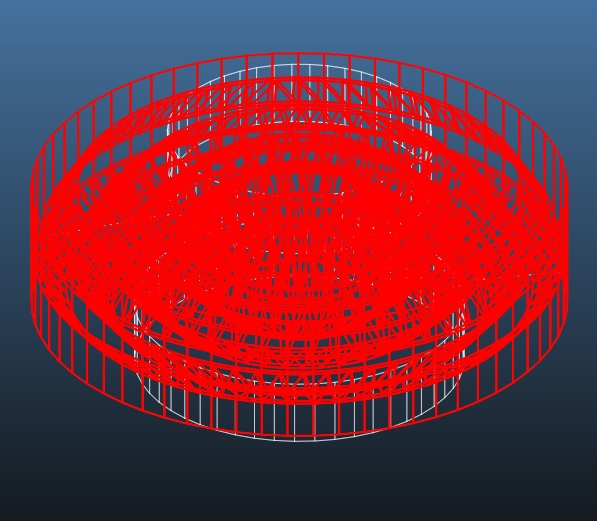
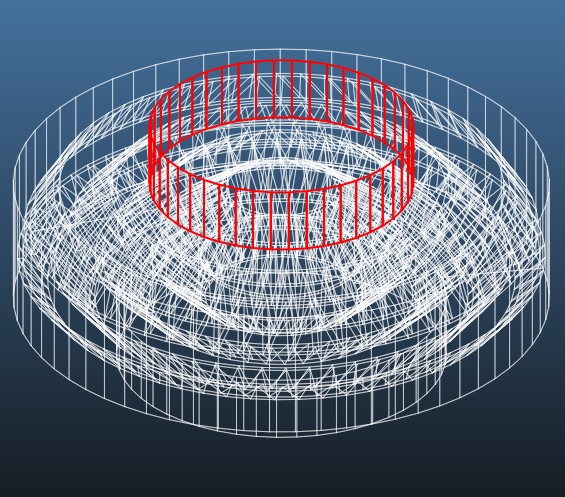
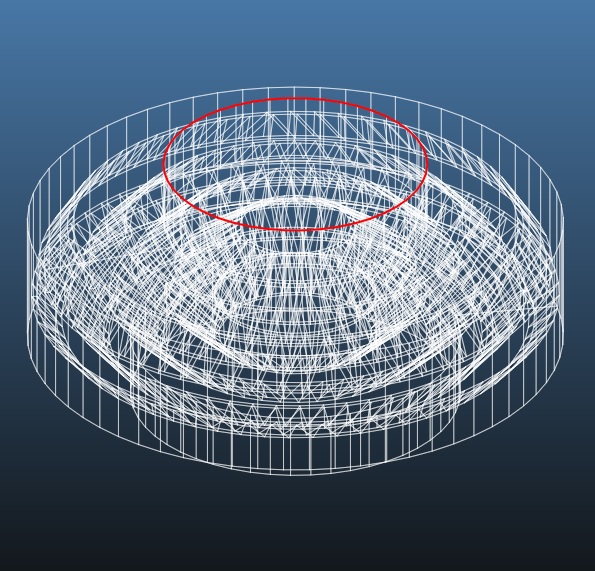
To make simulations easier for running multiple cases of outgassing loads, the major outgassing load groups were selected and saved. Each selection represents the major load associated with the selection, assigned to the facets. Actual numbers used for outgassing for every component and material in the system were previously calculated. Outgassing load calculations can be found in the Engineering Design Calculations section of the Integrated High Vacuum Test Stand documentation page. Major gas loads included in the simulation are outgassing from wall materials during pumpdown, as well as the total outgassing load from the various o-rings in the system, which uses the combined total gas load from outgassing as well as permeation.
Three different simulations were run to compare differences in ultimate pressure based on system conditioning. For each condition, appropriate calculated loads due to outgassing an permeation were calculated and applied to the respective facets. The simulation runs are as follows:
- Simulation 1 – Unbaked, Pumped for <1 Hour
- Simulation 2 – Unbaked, Pumped for >24 Hours
- Simulation 3 – Baked, Pumped for >24 Hours
I. Diffusion Pump Inlet and O-Ring
Simulation 1: Unbaked System, Pumped for <1 Hour
- Pumping Speed – 600 l/s
- Total Outgassing Load (Viton) – 9.708 x 10^-5 mbar*l/s
Simulation 2: Unbaked System, Pumped for >24 Hour
- Pumping Speed – 600 l/s
- Total Outgassing Load (Viton) – 6.049 x 10^-6 mbar*l/s
Simulation 3: Baked System, Pumped for >24 Hour
- Pumping Speed – 600 l/s
- Total Outgassing Load (Viton) – 3.774 x 10^-6 mbar*l/s
II. Adapter Plate 1
Simulation 1: Unbaked System, Pumped for <1 Hour
- Outgassing Rate (Aluminum) – 1.066 x 10^-6 mbar*l/s/cm^2
Simulation 2: Unbaked System, Pumped for >24 Hour
- Outgassing Rate (Aluminum) – 1.333 x 10^-10 mbar*l/s/cm^2
Simulation 3: Baked System, Pumped for >24 Hour
- Outgassing Rate (Aluminum) – 6.665 x 10^-13 mbar*l/s/cm^2
III. Adapter Plate 1 and O-Ring
Simulation 1: Unbaked System, Pumped for <1 Hour
- Total Outgassing Load (Viton) – 3.035 x 10^-4 mbar*l/s
Simulation 2: Unbaked System, Pumped for >24 Hour
- Total Outgassing Load (Viton) – 7.431 x 10^-6 mbar*l/s
Simulation 3: Baked System, Pumped for >24 Hour
- Total Outgassing Load (Viton) – 5.535 x 10^-6 mbar*l/s
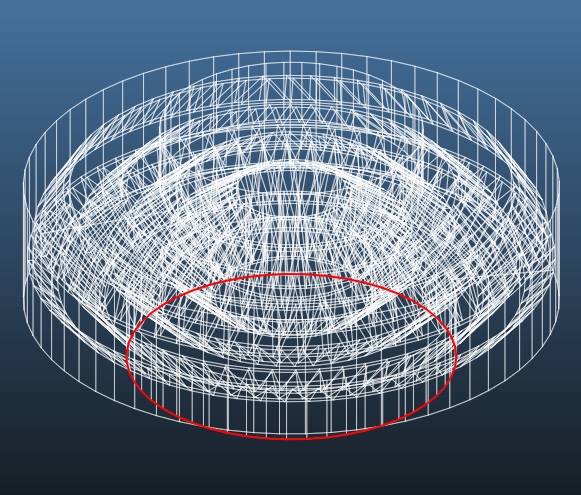
IV. Baffle
Simulation 1: Unbaked System, Pumped for <1 Hour
- Outgassing Rate (Stainless Steel) – 6.665 x 10^-8 mbar*l/s/cm^2
Simulation 2: Unbaked System, Pumped for >24 Hour
- Outgassing Rate (Stainless Steel) – 1.333 x 10^-10 mbar*l/s/cm^2
Simulation 3: Baked System, Pumped for >24 Hour
- Outgassing Rate (Stainless Steel) – 3.999 x 10^-13 mbar*l/s/cm^2
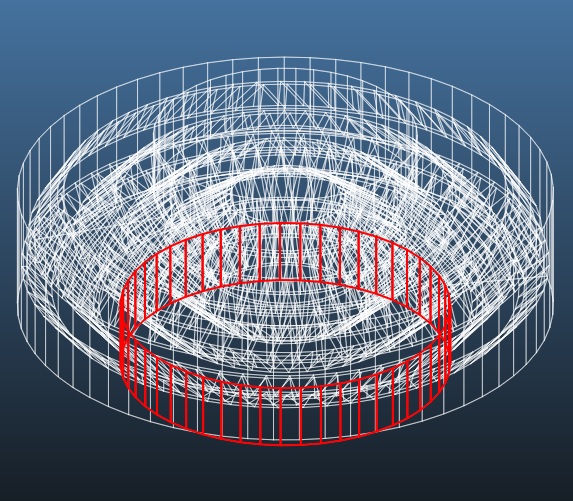
V. Baffle O-Ring and Adapter Plate 2

Simulation 1: Unbaked System, Pumped for <1 Hour
- Total Outgassing Load (Viton) – 3.527 x 10^-4 mbar*l/s
Simulation 2: Unbaked System, Pumped for >24 Hour
- Total Outgassing Load (Viton) – 7.499 x 10^-6 mbar*l/s
Simulation 3: Baked System, Pumped for >24 Hour
- Total Outgassing Load (Viton) – 6.599 x 10^-6 mbar*l/s
VI. Adapter Plate 2
Simulation 1: Unbaked System, Pumped for <1 Hour
- Outgassing Rate (Aluminum) – 1.066 x 10^-6 mbar*l/s/cm^2
Simulation 2: Unbaked System, Pumped for >24 Hour
- Outgassing Rate (Aluminum) – 1.333 x 10^-10 mbar*l/s/cm^2
Simulation 3: Baked System, Pumped for >24 Hour
- Outgassing Rate (Aluminum) – 6.665 x 10^-13 mbar*l/s/cm^2
VII. Adapter Plate 2 O-Ring and Blank-Off
Simulation 1: Unbaked System, Pumped for <1 Hour
- Total Combined Outgassing Load (O-ring and Blank) – 4.718 x 10^-5 mbar*l/s
Simulation 2: Unbaked System, Pumped for >24 Hour
- Total Combined Outgassing Load (O-ring and Blank) – 4.060 x 10^-6 mbar*l/s
Simulation 3: Baked System, Pumped for >24 Hour
- Total Combined Outgassing Load (O-ring and Blank) – 3.140 x 10^-6 mbar*l/s
SIMULATION COMPARISON: MOLECULAR TRAJECTORIES
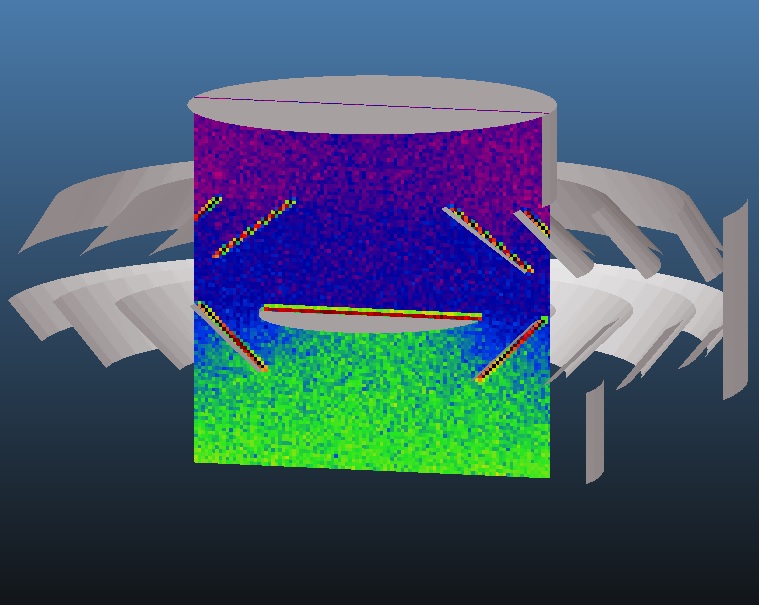
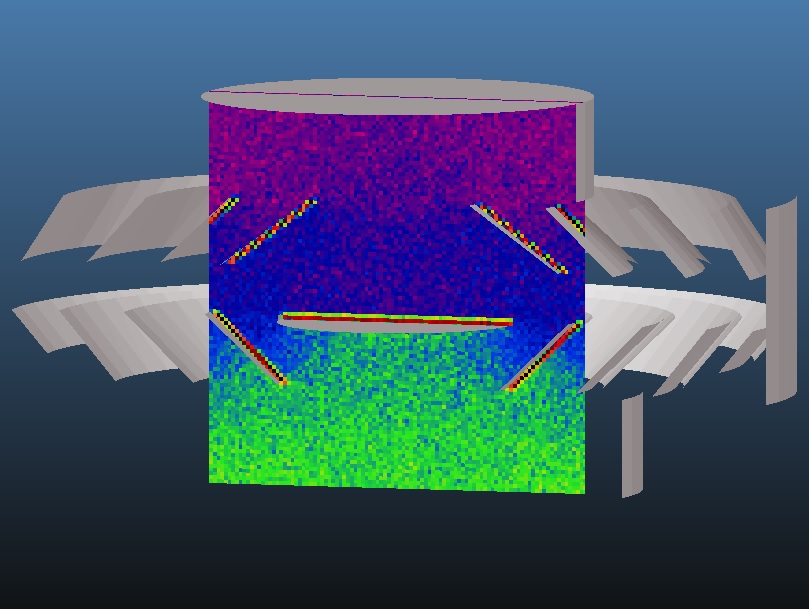
Molflow+ includes many powerful functions, including the ability to simulate and track particle trajectories in a system. Below are snapshots of average trajectories of pumped molecules (in this case air) in the system. The picture on the left details average molecular trajectories with maximum lines shown (2048). The picture on the right shows reduced lines to see average trajectories more clearly (500).

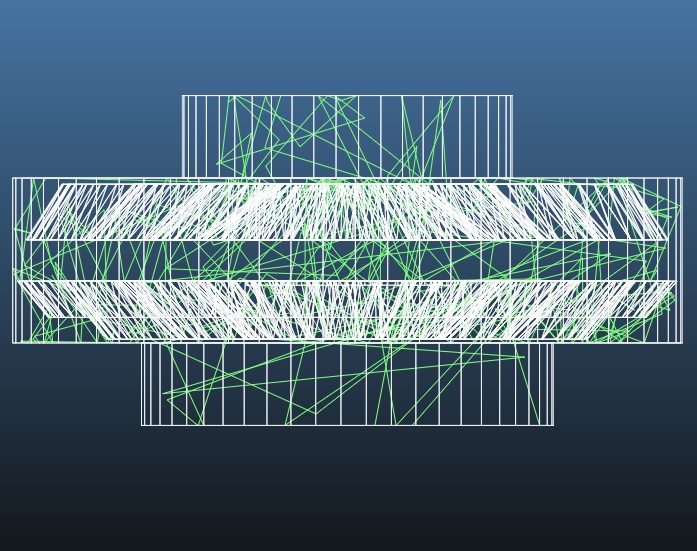
As can be seen from the results, the bulk of molecular trajectories and particle collisions occur within the water cooled baffle. This is both due to the higher overall outgassing rate of the baffle and associated o-ring seals used with the baffle, as well as the large surface area of the baffle, which is utilized primarily to limit backstreaming of heavy oil vapors from the diffusion pump beneath it. With a pumping speed of 600 l/s with air at 273.15K, the resulting calculated effective speed at the inlet of the blanked-off chamber adapter is around 408 l/s for Simulation 1. This value drops slightly, to 397 l/s for Simulation 2, and to 392 l/s for Simulation 3. These results are much higher than the hand calculated estimate of 204 l/s for air, which was to provide an initial worst-case ballpark estimate for effective pumping speed of the system.
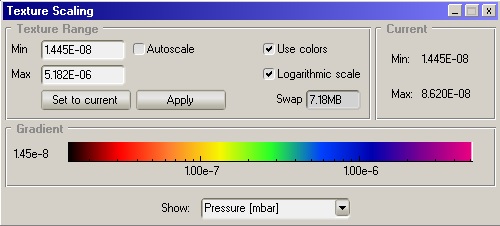
SIMULATION COMPARISON: NORMALIZED PRESSURE MAPPING
The following simulation results show the normalized pressure mapping for each of the three simulation conditions for direct comparison of changes in ultimate pressures in the system between the cases. From left to right, the results show Simulation 1, Simulation 2, and Simulation 3 respectively.
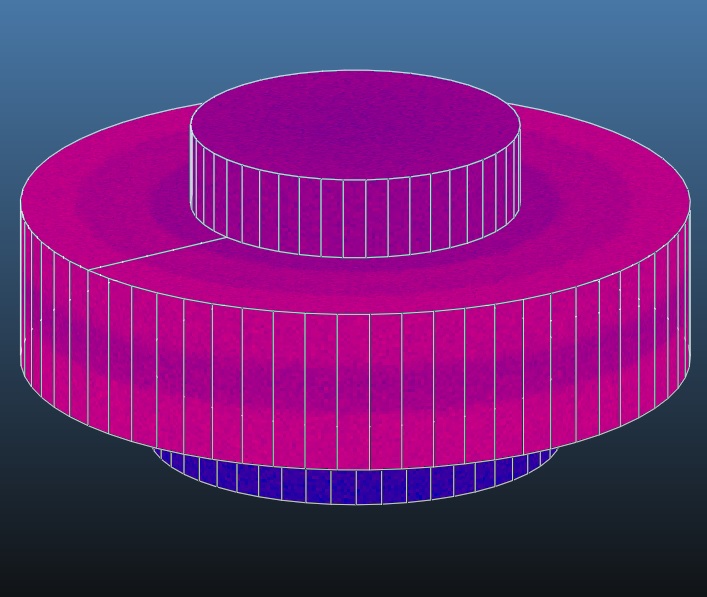
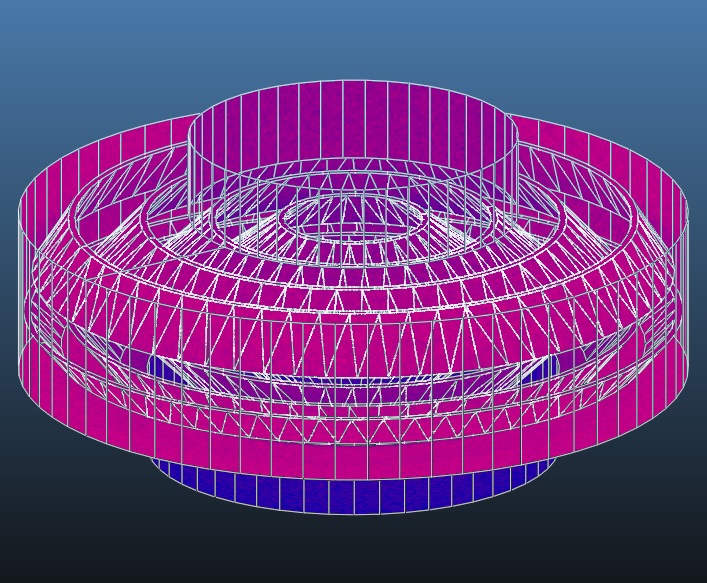
SIMULATION 1: UNBAKED SYSTEM, PUMPED FOR <1 HOUR
Simulation 1 explores the ultimate vacuum of the blanked off system for outgassing load parameters for all materials in the system when unbaked and pumped for less than one hour. Gas loads for each facet assignment are detailed above for reference. Each outgassing load was calculated based on surface area, material, and associated outgassing rate of the material for unbaked materials pumped for less than one hour. The pump speed of 600 l/s was applied at the baffle inlet, using air at 293.15K for simplicity. Real leaks, virtual leaks, and backstreaming from the pump were also neglected for simplicity.
As can be seen from the above simulation results, the ultimate pressure of the diffusion pumped system at the blank-off is the highest of the three cases as expected, with an average value of around 2.6*10^-6 mbar at the blanked-off chamber inlet. This is due to the higher outgassing loads of the unbaked, un-pumped surfaces and viton o-rings used in the system. At the pump inlet, the average pressure is around upper 1.4*10^-6 mbar, only slightly lower that at the blank. Since more than 60% of the total pumping speed is maintained through the baffle, the high pumping speed of the system can help offset the outgassing loads from the unprepared materials. The ultimate pressure of the system at the blank is almost exactly the same as the initial calculated estimate of 4.407 x 10^-6 mbar.
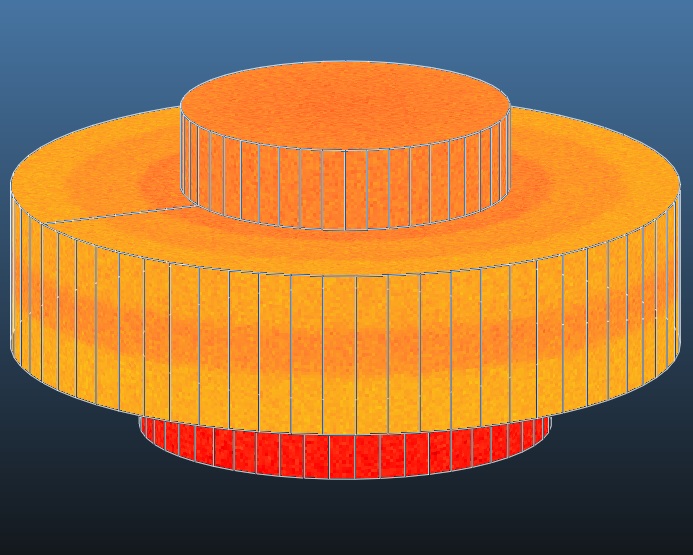
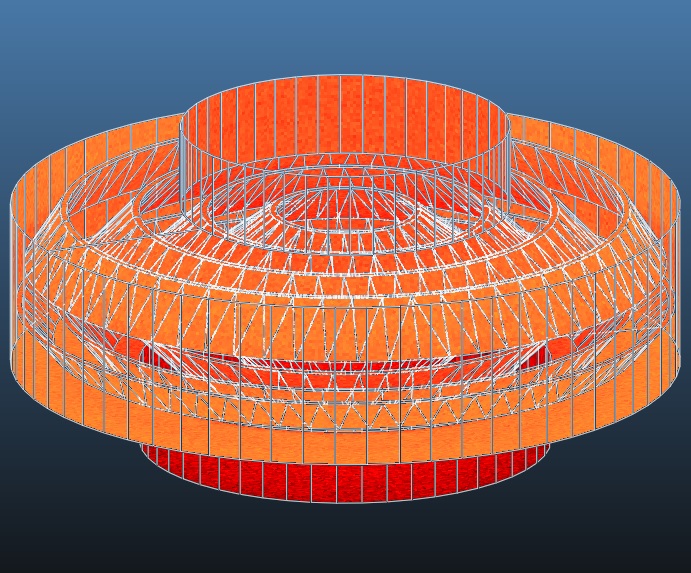
SIMULATION 2: UNBAKED SYSTEM, PUMPED FOR >24 HOURS
Simulation 2 explores the ultimate vacuum of the blanked off system for outgassing load parameters for all materials in the system when unbaked and pumped for greater than 24 hours. This represents a much better pumped and prepared system as opposed to Simulation 1, which is to be expected during the very first pumpdown of the system. Gas loads for each facet assignment are detailed above for reference. Each outgassing load was calculated based on surface area, material, and associated outgassing rate of the material for unbaked materials pumped for greater than 24 hours. Like the previous simulation study, the pump speed of 600 l/s was applied at the baffle inlet, using air at 293.15K for simplicity. Real leaks, virtual leaks, and backstreaming from the pump were also neglected for simplicity.
As can be seen from the above simulation results, the ultimate pressure of the diffusion pumped system at the blank-off shows noticeable improvement over the system when it just starts up new and un-pumped. The average value at the blank-off now drops to around 6*10^-8 mbar, which is almost two orders of magnitude improvement over the previous case where the system had not yet been baked or pumped down for a significant duration of time. At the inlet of the diffusion pump, the ultimate pressure also drops to about 3.5*10^-8 mbar. This exemplifies the importance of long-term pumping and preparation of a vacuum system. As pump times are increased, outgassing loads drop to lower levels. However, as will be examined from the next case, while outgassing can be lowered to negligible amounts, the ultimate vacuum level attainable is still limited by permeation of gas through the bulk material of the viton o-rings.
The ultimate pressure of the system at the blank is reasonably close to the initial calculated estimate of 1.049 x 10^-7 mbar, providing a good estimated range of expected ultimate pressures.
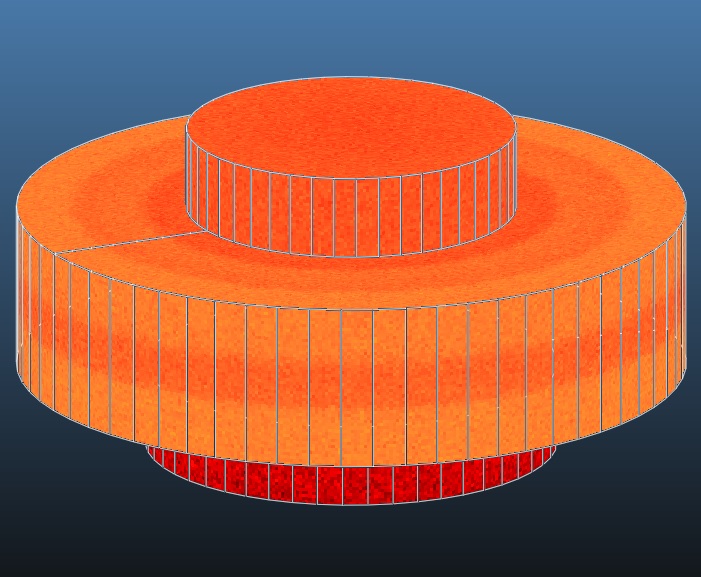
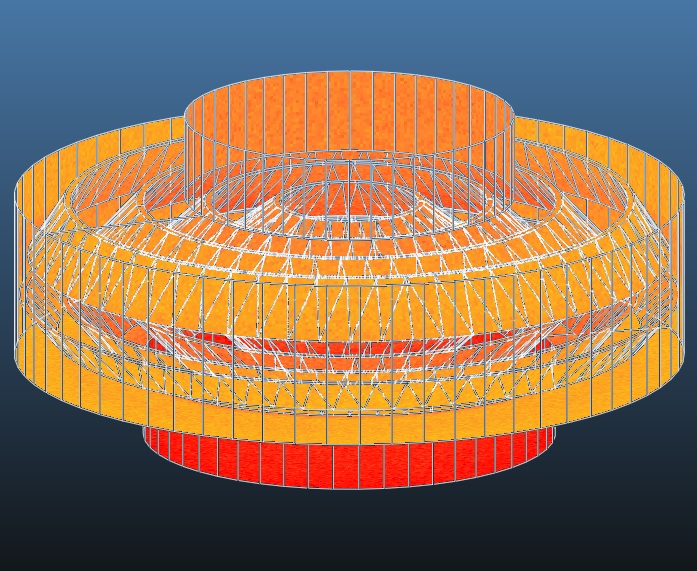
SIMULATION 3: BAKED SYSTEM, PUMPED FOR >24 HOURS
Simulation 3 explores the best possible case scenario for ultimate vacuum of the blanked off system for outgassing load parameters for all materials in the system when baked thoroughly and pumped for periods of greater than 24 hours. This represents ideal UHV system preparation with fully minimized outgassing from all materials present in the system. Like the previous simulation studies, the pump speed of 600 l/s was applied at the baffle inlet, using air at 293.15K for simplicity. Real leaks, virtual leaks, and backstreaming from the pump were also neglected for simplicity.
As can be seen from the above simulation results, the ultimate pressure of the system does not improve significantly from the previous case. With the applied outgassing loads, the resulting ultimate pressure at the blank off port now drops to an average value of about 4.5*10^-8 mbar, which is only a slight improvement from the previous simulation case. At the diffusion pump inlet, the ultimate pressure is on average around 2.7*10^-8 mbar. The ultimate pressure is still limited to the 10^-8 mbar region however due to permeation of gas through the o-rings in the system. Despite the several large diameter o-rings in the system, excellent vacuum levels are expected, and are close to initial hand calculated estimates for the system. Permeation through the o-rings can be reduced by chilling the o-ring flanges to below ambient. By dropping the temperature of the viton material, permeation is reduced, which is proportional to material temperature, and can allow for an order of magnitude lower ultimate pressure as opposed to ambient conditions.
The ultimate pressure of the system at the blank is reasonably close to the initial calculated estimate of 7.481 x 10^-8 mbar, providing a good estimated range of expected ultimate pressures.
SIMULATION COMPARISON: PRESSURE PROFILE PLOTS
Along with pressure mapping of the system, pressure profile curves can be generated for any part of the system as desired. For the following results, a transparent measurement plane was added to intersect the model vertically through the center. The resulting pressure plots show the changes in pressure through the system from the inlet of the diffusion pump to the blanked-off chamber inlet. Y-axis units are in mbar, x-axis units are arbitrary length units, for which the measurement plane is divided into 100 equal segments. From left to right, the results show Simulation 1, Simulation 2, and Simulation 3 respectively.
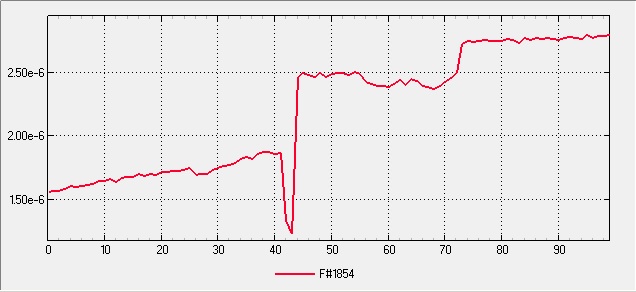
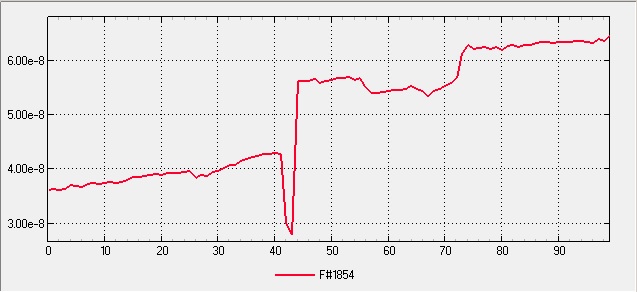
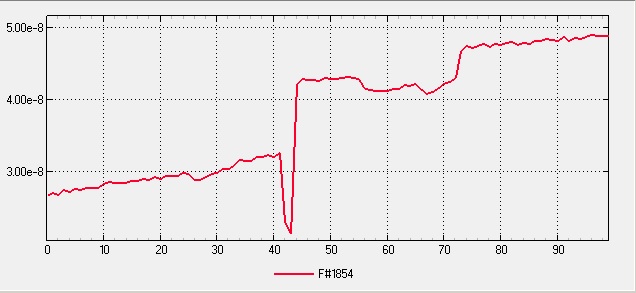

The above three graphs show the resulting pressure profile through the pumping assembly with linear plotting. Using this plot view, very clearly defined transitions between components in the pumping line can be observed. The highest value in the plots, seen as the large upper plateau, represents the pressure profile across the blank-off. Between 0 and 40, the pressure gradient increases slightly through the very shallow adapter plate, with a small transition occurring at 26 for the bottom half of the baffle. The decrease around 42 represents the central fin of the baffle, which directly blocks the pumping stream from the top to the inlet of the pump. The pressure rises rapidly towards the top of the baffle, where gas loads from the o-ring dominate, and where a decrease in pumping speed occurs due to the baffle. From 73 to 100, pressure rises slightly again through the second adapter plate to the blank-off. The resulting pressure for case 1 is noticeably higher than cases 2 and 3, however there is very little difference between case 2 and 3, indicating an ultimate pressure limit for the given system setup due to permeation through the viton o-rings.
CONCLUSION
An in-depth and detailed study of molecular flow simulations using Molflow+ for the Integrated High Vacuum Test Stand pumping assembly is presented. Simulation results show that with improved system preparation, increasingly higher vacuum levels can be expected, however the ultimate pressure is limited due to permeation of gas through the viton o-rings. In this case, the difference between long term pumping and long term baking/pumping is negligible, due to the permeation limits of the viton o-rings used in the system. However, the simulations verify that the pumping assembly, blanked off, can reach the desired ultimate pressures in the 10^-8 mbar regime, and verifies the engineering design of the assembly for pumpdown. Pressure profiles also allow for observing how the different components in the system effect ultimate pressures and pressure changes, and reveal the pressure gradient across the system, which is particularly interesting to observe for the behavior of the baffle. Molecular trajectory maps also show that the bulk of outgassing load resides within the baffle, primarily between the upper and lower baffle rings, as anticipated. The results also show the effectiveness of the baffle isolation for molecular flow. The resulting effective speed at the blanked-off chamber was also estimated by the software to be between around 392 and 408 l/s, which shows that the effective pumping speed is retained between 65% and 68% of the speed of the diffusion pump, showing optimized baffle design for maximum throughout, as well as optimal pipeline geometry for maximizing pumping speed at the inlet of attached chambers on the second adapter plate.
With the above results, and confirmed validity of the pumping design, efforts can be made to proceed with further molecular flow simulations for the chambers to be used with the test stand pumping station.
SIMULATION FILES
-
Integrated High Vacuum Pump Assembly Final – Unbaked and Pumped 1hr.ZIP
-
Integrated High Vacuum Pump Assembly Final – Unbaked and Pumped 24hr.ZIP
-
Integrated High Vacuum Pump Assembly Final – Baked and Pumped 24hr.ZIP